William MacAskill misrepresents the evidence underlying his key arguments in "Doing Good Better"
created: ; modified:A note:
- When I was writing the essay, I figured I should send the draft to someone close to MacAskill to make sure I’m not misrepresenting his views or arguments. I didn’t want to send it to him because I perceived the probability of him not respecting the confidentiality of my draft to be quite high.
- I sent a draft of the essay to Julia Wise for review due to her designation as the contact person for reporting concerns about the EA community, a movement co-founded by MacAskill. The page is still live and says: “If you contact me about a problem you’ve experienced or a concern you have, I will keep it as confidential as you wish.” (three years later, after I first wrote about what happened publicly, Wise added a note to the post writing “Someone sent me a draft of a critique of my colleague’s book, which I agreed to keep confidential. In deciding what to do with the email chain the following week, I forgot that they had asked for confidentiality in the first message, and sent it to my colleague. You can read more detail here.”)
- Prior to me sending Wise the draft, she agreed to keep it confidential. My first email to her started with: Hi Julia, / I’m writing you, because of your role as a contact person for EA community. Please do not share this email / its contents with anybody. / I’m writing a very critical review of Doing Good Better. I aim to be as accurate as possible and would be very thankful if you checked my review, before me publishing it, so that I could be sure that I didn’t unintentionally misinterpret the book. Please let me know if you’ll have time to do this."
- When I sent the review to Wise I noted additionally: “(sorry for repeating but please don’t discuss the post with anybody!)”
- Wise then refused to read it, citing time constraints, and leaked it to MacAskill.
- Neither Wise, nor anyone from MacAskill’s team, nor MacAskill himself thought it’s worth letting me know that my draft was read by them, despite me still believing that it was confidential
- Several days after Wise sent my email to MacAskill’s team and already having realized that I asked for confidentiality, she emailed me writing “If you’re able to let me know when it’s likely to be published, I’d appreciate that as then I can let Will know to take a look.”
- I only learned that my draft was read by anyone except for Wise when MacAskill published a response to my essay on EA Forum and that response contained an argument about something I wrote in the draft but removed prior to the essay publication. His response also noted that “Alexey’s post keeps changing, so if it looks like I’m responding to something that’s no longer there, that’s why.”
- If you’re an EA, you might be asking: “so what? You had some book criticism. Yes, it’s unfortunate that the criticism was accidentally leaked, but it’s not like someone assaulted you or something. Why are you making it seem like it’s something serious?”
- The reason everyone involved tried to hide it instead of simply writing me a note saying “oops, sorry, I accidentally sent/read the draft” is because it was taken extremely seriously by people involved and it was precisely the reason why the people involved (Wise, MacAskill, his team) tried to cover up the leak. This was explicitly confirmed by MacAskill, with him writing: “the draft you sent to Julia was quite a bit more hostile than the published version; I can only say that as a result of this I felt under attack, and that clouded my judgment.” Note that this reaction was in response to me specifically asking for feedback from someone close to MacAskill, thus credibly demonstrating good faith, while writing “I aim to be as accurate as possible and would be very thankful if you checked my review, before me publishing it, so that I could be sure that I didn’t unintentionally misinterpret the book”.
- As a result of all of this, the EA community decided to do… absolutely nothing:
- Julia Wise remains the contact person for the EA community. No sanctions were taken against her by the community.
- William MacAskill remains the thought leader and the central figure of the community. No sanctions were taken against him or anyone on his team by the community.
Conflicts of interest: in 2018 I unsuccessfully applied for Grants Evaluator position at the Centre for Effective Altruism and for Research Analyst position at Open Philanthropy.
Whenever possible I use Internet Archive to link to sources, dated at MacAskill’s citation date of them.
Many people disagree with this post strongly, so to get the full picture I strongly suggest reading discussions on the Effective Altruism Forum (25 votes with a total score of 0 and 40 comments), including William MacAskill’s response; on /r/slatestarcodex (30 points, 74 comments); on /r/effectivealtruism (9 points, 17 comments).
Background
William MacAskill is an Associate Professor of Philosophy at Oxford University and a Senior Research Fellow at Global Priorities Institute. He co-founded Giving What We Can, Centre for Effective Altruism, and 80,000 Hours. He is one of the founders of the Effective Altruism movement.
His book, Doing Good Better: How Effective Altruism Can Help You Make a Difference, published in 2015, was endorsed by Steven Levitt, Steven Pinker, Peter Singer, Julia Galef, and Tyler Cowen (IA, archive.fo). It appears to be endorsed by the Centre for Effective Altruism (IA, archive.fo).
I read this book on the basis of a recommendation by my best friend, who is an Effective Altruist. I have a habit of checking the sources of the books that I read. With Doing Good Better, this habit very quickly started to bring fruit. I found that MacAskill regularly misquotes and misrepresents his sources.
Summary
In this post, I show that in Doing Good Better, William MacAskill repeatedly misrepresents his sources and uses these misrepresentations to advance the book’s key conclusions.
I show that:
- MacAskill applies different criteria to different programs while directly comparing them and arguing that one is better than the other. He argues against distributing textbooks on the basis of absence of effect on test scores, but he ignores the absence of effect on test scores for deworming, which he compares to distributing textbooks.
- MacAskill selectively reports the findings that support his argument from a deworming paper he cites. He writes about increased income, increased working hours, increased tax revenue. He doesn’t mention absence of impact of deworming on hemoglobin level, grades of schooling attained, test scores, etc.
- MacAskill interprets GiveWell’s cost-effectiveness estimates literally. For example, he writes that GiveWell’s Against Malaria Foundation (AMF) estimate is “most rigorous” and that £20,000 is enough to save ten lives on the basis of it.
- In 2011, Holden Karnofsky (co-founder of GiveWell) wrote in a blog post that “A is X times more effective than Y” arguments require taking cost-effectiveness estimates literally
- In 2014, GiveWell AMF page wrote “we believe that cost-effectiveness estimates such as these should not be taken literally” while linking to that blog post
- MacAskill used GiveWell AMF cost-effectiveness estimate and wrote “you would, by this estimate, provide five hundred times the benefit as you would by spending the same amount of money treating Kaposi’s sarcoma.”
- I interpreted 3 as contradicting 1 and 2
- GiveWell does not believe that my argument is sound and is happy with MacAskill’s presentation of its estimates. I asked GiveWell for permission to post our email exchange and you can look at its response first-hand. I found the response perplexing. In particular, GW confuses their blog posts in its response to me (they write the post was written in 2008 when it was written in 2011) and doesn’t address the quotes by Holden Karnofsky I provide.
- MacAskill introduces the “100x Multiplier”, despite knowing that in 2011 GiveWell found one estimate (DCP2 deworming estimate), on the basis of which he previously made a “100 times more effective” argument, to be optimistic by a factor of about 100.
- As far as in 2014, Giving What We Can continued to rely on these DCP2 estimates.
- MacAskill rhetorically asks whether not taking any salary as a charity’s CEO means the charity is amazing, implying that this is what Charity Navigator’s views lead to. MacAskill provides a quote from Charity Navigator’s site as a demonstration of its position. The very first sentence that follows MacAskill’s quote from Charity Navigator’s site demonstrates that he misquotes and misrepresents Charity Navigator’s position.
- MacAskill writes that income increases happiness solely based on a correlation between income and happiness, despite later in the book writing “Of course, correlation is not causation”.
1, 2 are important because deworming is one of the causes MacAskill recommends the most and it’s a central case study that he uses to advance the EA style of program evaluation.
3, 4 are important because the literal interpretation of these estimates underlies MacAskill’s key arguments about which charities to donate your money to and which career to choose to spend your life on.
5 is important because it demonstrates that MacAskill misquotes his sources even in cases when it’s impossible to do so by accident and it is most curious because the misrepresentation doesn’t even help any of his key arguments.
I discuss 6 and several other, harder to explain or less egregious, misquotes and misrepresentations in Addendum.
Educational benefits of distributing textbooks and deworming
Summary of this section
MacAskill contrasts the effects of deworming to other programs, while applying different criteria to them and then proceeds to cherry pick the most favorable results from the paper he cites.
MacAskill (please see appendix for full context):
ICS had been trying to improve school attendance and test scores. …
With the help of collaborators, Kremer tested the different ICS programs one by one. First, he looked at the efficacy of providing schools with additional textbooks. Classrooms would often have only one textbook for a class of thirty, so it seemed obvious that providing more textbooks would help students learn. However, when Kremer tested this theory by comparing test scores between schools that received books and those that didn’t, he found no effect for all but the most high-achieving of students. [emphasis mine]
Let’s pause here for a moment. We see that distributing textbooks (we’ll call it Program A) is not very useful — it has no impact on learning, instrumented for by test scores, for most students. But suppose, there is some program B that was also evaluated and for which we have the data about its impact on test scores and its impact on school attendance. If we wanted to compare Program A to Program B, how would we do it?
It seems clear that if we have the data about the impact each program has on test scores, we should compare them. And, in addition to that, we also may look at attendance. Let’s return to MacAskill:
Absenteeism is a chronic problem in schools in Kenya, and deworming reduced it by 25 percent. In fact, every child treated spent an extra two weeks in school, and every one hundred dollars spent on the program provided a total of ten years of additional school attendance among all students. Enabling a child to spend an extra day in school therefore cost just five cents. It wasn’t merely that deworming children “worked” at getting children into school. It worked incredibly well.
What’s more, deworming didn’t merely have educational benefits. It had health and economic benefits, too. Intestinal worms can cause a variety of maladies, including anemia, intestinal obstruction, and a suppressed immune system that can increase the risk of other diseases like malaria. Deworming decreases all these risks. [emphasis mine]
Notice the substitution: when MacAskill wants to show no effect, he uses test scores; when he wants to show effect, he uses school attendance. If test scores do matter, it’s dishonest to not mention them for deworming; if they don’t matter, it’s dishonest to use them against distributing textbooks. You could suspect that we simply don’t know the impact of deworming on test scores, but this is not the case. The deworming paper MacAskill cites (Miguel and Kremer, 2004) here did evaluate the impact of deworming on test scores — MacAskill just chooses not to tell us about it, selectively picking metrics that support his conclusion:
… The program reduced school absenteeism in treatment schools by one-quarter, and was far cheaper than alternative ways of boosting school participation. … Yet we do not find evidence that deworming improved academic test scores. [emphasis mine]
MacAskill uses absence of effect on test scores as evidence against distributing textbooks, but does not use absence of effect on test scores as evidence against deworming, while comparing these programs.
Later in the book (in chapter three), MacAskill again uses school attendance to show how effective deworming is, while not mentioning the absence of effect on test scores:
deworming schoolchildren does fifteen times better than that [providing free school uniforms], with 139 total years of school per $1,000.
Cost-effectiveness estimates
Note: GW is happy with MacAskill’s presentation of its estimates. See top of this post for an explanation.
Summary of this section
- In 2010, MacAskill interpreted cost-effectiveness estimates literally.
- In 2011, GiveWell wrote a blog post in which they argued against using cost-effectiveness estimates literally and used MacAskill’s use of cost-effectiveness estimates as one of the examples of that.
- In 2011, GiveWell found DCP2 deworming estimates to be optimistic by a factor of about 100.
- In 2014, GiveWell published their cost-effectiveness estimate of Against Malaria Foundation and wrote “we believe that cost-effectiveness estimates such as these should not be taken literally” one paragraph after the estimate.
- In 2014 (i.e. three years later), Giving What We Can flagship page (first in the Key Pages menu) still said “even restricted to the field of health programs in developing countries, research shows that some are up to 1,000 times as effective as others”, with DCP2 estimates being the reference (IA, my screenshot of IA, archive.fo).
- In 2015, MacAskill published a book in which he
- Interprets GiveWell’s AMF cost-effectiveness estimate literally
- Makes “100 times more effective” arguments
MacAskill interprets GiveWell’s AMF estimate in a way they specifically wrote not to interpret it
MacAskill writes that $3400 is the cost to save a life in the developing world, based on “the most rigorous estimates”:
What we’ve seen is that thinking carefully about how you can do the most to benefit others doesn’t just allow you to do a bit more good—it enables you to do vastly more than you might have done otherwise.
Imagine saving a single person’s life: you pass a burning building, kick the door down, rush through the smoke and flames, and drag a young child to safety. If you did that, it would stay with you for the rest of your life. If you saved several people’s lives—running into a burning building one week, rescuing someone from drowning the next week, and diving in front of a bullet the week after—you’d think your life was really special. You’d be in the news. You’d be a hero.
But we can do far more than that.
According to the most rigorous estimates, the cost to save a life in the developing world is about $3,400 (or $100 for one QALY [Quality-adjusted life year]). This is a small enough amount that most of us in affluent countries could donate that amount every year while maintaining about the same quality of life. Rather than just saving one life, we could save a life every working year of our lives. Donating to charity is not nearly as glamorous as kicking down the door of a burning building, but the benefits are just as great. Through the simple act of donating to the most effective charities, we have the power to save dozens of lives. That’s pretty amazing. [emphasis mine]
The GiveWell page (archive.fo) MacAskill cites for this estimate says:
Using $5.30 as the total cost per net in Malawi and $7.50 for DRC, we estimate the cost per child life saved through an AMF-funded LLIN distribution at about $3,340 [81]
This does not include other potential benefits of LLINs (non-fatal cases of malaria prevented, prevention of deaths in age groups other than under-5 year olds, prevention of other mosquito-borne diseases, etc.). Full details at our report on mass distribution of LLINs.
As a general note on the limitations to this kind of cost-effectiveness analysis, we believe that cost-effectiveness estimates such as these should not be taken literally, due to the significant uncertainty around them. We provide these estimates (a) for comparative purposes and (b) because working on them helps us ensure that we are thinking through as many of the relevant issues as possible. [emphasis mine]
Here are more examples of MacAskill interpreting that estimate literally. Writing about “five hundred times the benefit”:
the QALY allows us to make comparisons across very different programs that combat very different illnesses. By donating to the Against Malaria Foundation, which buys and distributes long-lasting insecticide-treated bed nets, you would, by this estimate, provide five hundred times the benefit as you would by spending the same amount of money treating Kaposi’s sarcoma. [emphasis mine]
Writing about $100 per QALY and “five hundred times” more benefit:
In the United States, public health experts regard any program that provides one QALY for less than $50,000 as a good value, and health programs will often be funded even if the cost per QALY is much higher than $50,000. In contrast, providing the same benefit in poor countries (such as by distributing insecticide-treated bed nets to prevent the spread of malaria) can cost as little as one hundred dollars. That means that, with a given amount of money, you can benefit people in poor countries five hundred times more than people in rich countries.
Again, we see the 100x Multiplier at work. We’re about one hundred times richer than the poorest billion people in the world, and we can do several hundred times more to help them than we can to help others in the rich countries we live in. [emphasis mine]
MacAskill used this estimate in precisely the way GiveWell warned against, by interpreting it literally.
Why am I so sure that MacAskill interprets GiveWell’s estimate in a way they don’t want it to be interpreted? Maybe they mean something else by “interpreting it literally”, than what MacAskill does?
Here’s the reason: because in 2011, Holden Karnofsky (a co-founder of GiveWell and the Executive Director of Open Philanthropy) expressed precisely the same concern, although wording it very carefully, about MacAskill’s (and GWWC’s) use of cost-effectiveness estimates. In the comments section of his Why We Can’t Take Expected Value Estimates Literally (Even When They’re Unbiased) (archive.fo) post, Karnofsky has a lengthy exchange with Toby Ord (a co-founder of the Effective Altruism movement (archive.fo) and the founder of Giving What We Can (archive.fo)) in which he writes:
There are several cases in which Giving What We Can appears to take cost-effectiveness estimates literally even though they do not include adjustments of the sort described here. The quote from Will in the above post is one example; [i.e. Karnofsky literally used a quote from MacAskill as an example of a literal interpretation of a cost-effectiveness estimate in the post] another is the statement that “Charities which focus on STH, schistosomiasis, and LF are at the very top end of cost-effectiveness — about 100 times more effective than typical developing-world health interventions.” [emphasis mine]
And in another comment Karnofsky writes:
I think it is worth noting that Will’s 2010 comments appear inconsistent with the reasoning of this post (not just neglecting to mention it). He argues that even a deworming charity known to be wasting 26% of its money “still would do very well (taking DCP2: $3.4/DALY * (1/0.74) = $4.6/DALY – slightly better than their most optimistic estimate for DOTS [$5/DALY]” and concludes that “the advocacy questions [relevant to whether this 26% is spent effectively] don’t need to be answered in order to make a recommendation.” This is a much stronger statement than the one you attribute to him and seems to require taking the estimates literally. {emphasis mine}
So, as early as in 2011 Holden Karnofsky was concerned about MacAskill’s literal interpretation of cost-effectiveness estimates and about his use of “100 times more effective” argument.
Here’s an entire subsection devoted to that,
MacAskill’s 100x Multiplier
During his discussion of life satisfaction and income, MacAskill introduces the “100x Multiplier”:
This idea is important enough that I’ve given it a name. I call it the 100x Multiplier. For those of us living in rich countries, you should expect to be able to do at least one hundred times as much to benefit other people as you can to benefit yourself. [emphasis mine]
And lest you think that he is being metaphorical, he clarified what he thinks about the Multiplier in Notes:
Note that the figure of one hundred is a baseline. I believe that if we try hard, we should be able to do even more good for even less personal cost. This is for two reasons. First, we’ve only looked at one problem: global poverty. As discussed in chapter ten, there may be even better opportunities for helping others, in which case the 100x Multiplier is an underestimate. [emphasis mine]
Later, MacAskill combines his literal interpretation of GiveWell’s $3,400 estimate with earning-to-give:
Earlier I said that one of the most cost-effective ways to save lives is by distributing antimalarial bed nets: $3,400 pays for 560 nets, which on average will prevent one death due to malaria. By pursuing medical oncology, Greg could therefore donate 50 percent of his $200,000 per year earnings while still having a very comfortable $100,000 per year pretax salary (donations are tax-deductible). His donations would save dozens of lives a year, considerably more than he could have done if he’d worked directly in a poor country. …
In 2014, Greg donated £20,000, enough to save ten lives. [emphasis mine]
Wait. But what if I am wrong, after all, and MacAskill does realize that these estimates are not precise and they are just estimates? Here’s MacAskill:
Importantly, the cost-effectiveness estimates given are just that: estimates. The figures for Kaposi’s sarcoma, condom distribution, and antiretroviral therapy are individual estimates based on specific contexts and may therefore be optimistic. The figure for bed-net distribution is more robust—the calculation behind it tries to correct for biases in favor of optimism, and takes into account the specific context in which the charities work—but even this estimate should not be taken as gospel. However, in the context of fat-tailed distributions, even rough estimates are vitally important for decision making. In the health-care graph, the best program is estimated to be five hundred times more effective than the worst program (which, remember, is still a good program). Even if the highest estimates were too optimistic by a factor of fifty, it would still be vitally important to focus on the best programs rather than merely good ones. [emphasis mine]
He doesn’t: he mouths the words but he doesn’t believe what he writes. He says that even if the highest estimates are optimistic by a factor of fifty — that’s ok, because the best program is five hundred times more effective.
Except that in 2011, GiveWell discovered (archive.fo) that the DCP2 cost-effectiveness estimate for deworming that GiveWell used and on the basis of which Giving What We Can (where MacAskill is a co-founder) recommended deworming (archive.fo) was off by a factor of about 100. MacAskill knew about this and even commented on the GiveWell post that announced DCP2 errors.
And in 2014, GiveWell’s optimistic estimate for Deworm the World Initiative’s cost per equivalent life saved differed from pessimistic by a factor of 2118 (GiveWell’s spreadsheet, local copy). MacAskill references the GiveWell page (archive.fo) that extensively discusses deworming and links to this spreadsheet when discussing impact of deworming on health in the book’s introduction.
By the way, in the book, MacAskill writes that the evidence behind Deworm the World Initiative is “fairly robust” and that the evidence behind Schistosomiasis Control Initiative is “very robust”.
Charity Navigator
MacAskill:
One popular way of evaluating a charity is to look at financial information regarding how the charity spends its money. How much does the charity spend on administration? How much is its CEO paid? What percentage of donations are put directly to the charity’s main programs? This is the approach that Charity Navigator, the oldest and most popular charity evaluator, has taken for the last fifteen years. According to Charity Navigator, “Savvy donors know that the financial health of a charity is a strong indicator of the charity’s programmatic performance. They know that in most cause areas, the most efficient charities spend 75 percent or more of their budget on their programs and services and less than 25 percent on fund-raising and administrative fees.”
Using these metrics, let’s see how the three charities compare.
Books For Africa’s overhead costs are a tiny 0.8 percent of their total expenditure (which was $24 million in 2013), and their CEO is paid $116,204, which is only 0.47 percent of that total expenditure. For these reasons, and for their general financial transparency, Charity Navigator has given BFA its highest four-star rating for seven years running. …
You certainly wouldn’t think about how much Apple and Microsoft each spend on administration, and you wouldn’t think about how much their respective CEOs are paid. Why would you? As a consumer you only care about the product you get with the money you spend; details about the financials of the companies who make the products are almost always irrelevant. If Apple spent a lot of money to attract a more talented management team, you might even consider that a good sign that their products were the best on the market!
If we don’t care about financial information when we buy products for ourselves, why should we care about financial information when we buy products for other people? Take a silly example: imagine I set up a charity that distributes doughnuts to hungry police officers and I am so enthusiastic about the mission that I manage to spend only 0.1 percent of the charity’s money on overhead, with the rest spent on doughnuts and distribution. Suppose, moreover, that I, as the CEO of this charity, don’t take a salary at all. Would I really have created an amazing charity? [emphasis mine]
According to MacAskill, the metrics Charity Navigator uses lead to an absurd conclusion that 0.1 percent overhead with zero CEO salary lead to a charity being considered amazing.
Here’s the full quote from the Charity Navigator’s page (archive.fo) that MacAskill cites:
Savvy donors know that the financial health of a charity is a strong indicator of the charity’s programmatic performance. They know that in most cause areas, the most efficient charities spend 75% or more of their budget on their programs and services and less than 25% on fundraising and administrative fees. However, they also understand that mid-to-large sized charities do require a strong infrastructure therefore a claim of zero fundraising and/or administrative fees is unlikely at best. They understand that a charity’s ability to sustain its programs over time is just as important as its short-term day-to-day spending practices. Therefore, savvy donors also seek out charities that are able to grow their revenue at least at the rate of inflation, that continue to invest in their programs and that have some money saved for a rainy day. All of this analysis is provided on Charity Navigator’s website for free, but when considering groups not found here, savvy donors ask the charity for copies of its three most recent Forms 990. Not only can the donor examine the charity’s finances, but the charity’s willingness to send the documents is a good way to assess its commitment to transparency. …
Sophisticated donors realize that charities need to pay their top leaders a competitive salary in order to attract and retain the kind of talent needed to run a multi-million dollar organization and produce results. But they also don’t just take the CEO’s compensation at face value; they benchmark it against similar-sized organizations engaged in similar work and located in the same region of the country. To help you make your own decision, Charity Navigator’s analysis reveals that the average CEO’s compensation of the charities we evaluate is almost $150,000. In general, salaries tend to be higher in the northeast and at arts and education charities. Sophisticated donors also put the CEO’s salary into context by examining the overall performance of the organization. They know it is better to contribute to a charity with a well-paid CEO that is meeting its goals than to support a charity with an underpaid CEO that fails to deliver on its promises. …
Although it takes some effort on their part to assess a charity’s programmatic impact, donors who are committed to advancing real change believe that it is worth their time. Before they make a contribution, they talk with the charity to learn about its accomplishments, goals and challenges. These donors are prepared to walk away from any charity that is unable or unwilling to participate in this type of conversation. [emphasis mine]
MacAskill completely misrepresents Charity Navigator’s views on overhead and on CEO pay. The only thing that we need to do to learn that he misrepresents Charity Navigator: read the very first sentence that MacAskill doesn’t cite.
Afterword
One thing I’m particularly stupefied by is the wide praise for the book. It came out in 2015. It was endorsed by a range of people I deeply respect. It was positively reviewed by Marginal Revolution (archive.fo), The Guardian (archive.fo), and Quillette (archive.fo).
80,000 Hours, which MacAskill co-founded, was funded by Y Combinator (archive.fo) and received $1,635,000 over 2017 (archive.fo) and 2018 (archive.fo) from Open Philanthropy. Although, Open Philanthropy did have some reservations regarding 80,000 Hours.
Previous versions of this post
I updated this post significantly, based on feedback from the community. For previous versions please see Web Archive.
Addendum: MacAskill’s Errata page
Here’s MacAskill’s Errata page for the book. I encourage you to check it out for yourself, especially the comments on Deworming (contrast his deworming cost thought experiment with Karnofsky’s 2010 blog post) and PlayPump (contrast his comment with Colin Morris’ response letter at the end of the page).
Note that that page doesn’t address any of my concerns with the book.
Addendum: GiveDirectly
GiveDirectly’s “independent evaluation”
MacAskill quotes GiveDirectly as saying (source of the quote):
An independent evaluation of our work in Kenya by Innovations for Poverty Action found that recipients use transfers for a wide variety of purposes that on average generate large income gains. Common uses range from buying food to investing in tangible assets such as housing and livestock to investing in children’s education.
Note that in the book MacAskill links to a 2013 draft of the GiveDirectly’s RCT paper (the same one GiveDirectly links in the quote above), which mentions Shapiro’s previous affiliation with GiveDirectly on pages 1 and 7 (Shapiro co-founded GiveDirectly). It’s difficult to call such an evaluation “independent”.
GiveDirectly’s reporting of the results
GiveDirectly (none of the archiving sites save the page correctly for some reason):
These conversations have demonstrated that we did a bad job in our initial note in describing the data and the range of interpretations one might take from them, including more negative interpretations. We take responsibility for that. The post was criticized for lacking “nuance and detail,” and we agree with that assessment.
The post they were responding to:
“So, what’s the problem,” you might ask. “You told us all of this in short form in your last post. Why run through it in more detail?” Well, I, along with others, did get some push back on my interpretation that the nine-month impacts are no longer there. In particular, GiveDirectly got in touch to inform me that I had missed their blog post on HS (18), published on February 14, 2018. This is true: I had missed it and immediately updated my post to set the record straight. Then, I read their post. I could barely believe what I was reading. I am pasting a paragraph from it here, but the whole post is short: please read it in its entirety, so you don’t have to take my word. …
Contrast this with the abstract of HS (18) above. Note, in particular, the lack of detail or nuance in the blog post. Whereas the HS (18) abstract mentions every time which estimate refers to what type of comparison, the above paragraph only gives us great news: all effects are sustained; new positive effects appeared; some effects are even larger now! Sigh… [emphasis mine]
Addendum: Animal Charity Evaluators (ACE)
MacAskill:
According to Animal Charity Evaluators (a research charity I helped to set up), by donating to charities like Mercy For Animals or the Humane League, which distribute leaflets on vegetarianism, it costs about one hundred dollars to convince one person to stop eating meat for one year.
According to The Actual Number is Almost Surely Higher (Internet Archive), ACE is systematically deceptive.
Also see Concerns with ACE research. Although, note that despite listing concerns, this article is very sympathetic to ACE, which results in rather amusing results. For example, The Actual Number is Almost Surely Higher says:
The research conducted by these organizations [ACE and The Humane League] is not merely unreliable, but systematically deceptive.
While Concerns with ACE research says:
ACE’s research has been criticised in the past, most notably in a December 2016 blogpost by Harrison Nathan. ACE’s research has improved since then with some of the most serious problems being resolved.
With research being systematically deceptive, apparently, simply being one of the problems.
Addendum: the deworming study of Sarah Baird, Joan Hamory Hicks, Michael Kremer, and Edward Miguel
Suppose, you deworm a bunch of children, later collect the data on them, e.g.
- did their hemoglobin levels increase?
- did they become happier?
- did their wellbeing improve?
- did their health expenditures fall?
But then you find that these variables didn’t move in the right direction. What do you do? Do you have to show these variables? Or can you drop them?
The four variables above were reported in May 2011 draft of Worms at Work: Long-run Impacts of Child Health Gains and returned the following results (Table 3):
- Hemoglobin (Hb) level (1999, 2001 parasitological survey samples): no effect
- Self-reported currently “very happy”: no effect
- Index of wellbeing (0 to 1): no effect
- Respondent health expenditures (medicine, in/out-patient) in past month (KSh): positive effect
The 2016 paper (including 26 tables from its supplement), published in Quarterly Journal of Economics, doesn’t report any of these.
| May 2011 draft | July 2011 draft | October 2011 draft | August 2012 draft | 2016 paper | |
|---|---|---|---|---|---|
| hemoglobin level | reported | reported | reported | ||
| currently “very happy” | reported | ||||
| index of wellbeing | reported | ||||
| health expenditures | reported |
I emailed the authors and two of them replied, writing that it could be the referees, who didn’t like too many variables being reported, the feedback from other economists, or it could simply that the paper became much different over the years with a lot of things being changed, not necessarily only these four variables. It could have been any of these things and I do not say that the authors of this paper deliberately reported only the variables that favored their conclusion — they didn’t. They reported a ton of variables, some supporting deworming, some not.
However, two things to think about:
-
The final 2016 paper looks as if these four variables were never collected in the first place. A paper that reports 10 variables, 6 of them pointing in some direction and 4 not pointing in that direction is a very different paper, than the one that reports 6 variables, all pointing in that direction.
-
These are the four variables that were included in a public draft at some point and were later dropped. How many variables were collected and were dropped before reaching any drafts?
My favorite quote from the final 2016 paper:
In the full sample, treatment respondents’ total nonagricultural earnings are 15.0% higher (112 shillings, std. err. 96, Table IV, Panel A), although the effect is not statistically significant. In the older than school age subsample, the effect is considerably larger at 22.6% (278 shillings, std. err. 167, p = .101). [emphasis mine]
Addendum: more misquotes and misrepresentations from Doing Good Better
These were either to difficult to explain in the main body or incidental and do not appear to be advancing the book’s key claims.
Life satisfaction and income
MacAskill:
In order to work out the relationship between level of income and level of subjective well-being, economists have conducted large-scale surveys of income levels and the subjective well-being of people in each of them. Their results are given in this graph, which shows the relationship between income and subjective well-being both within a country and across countries.
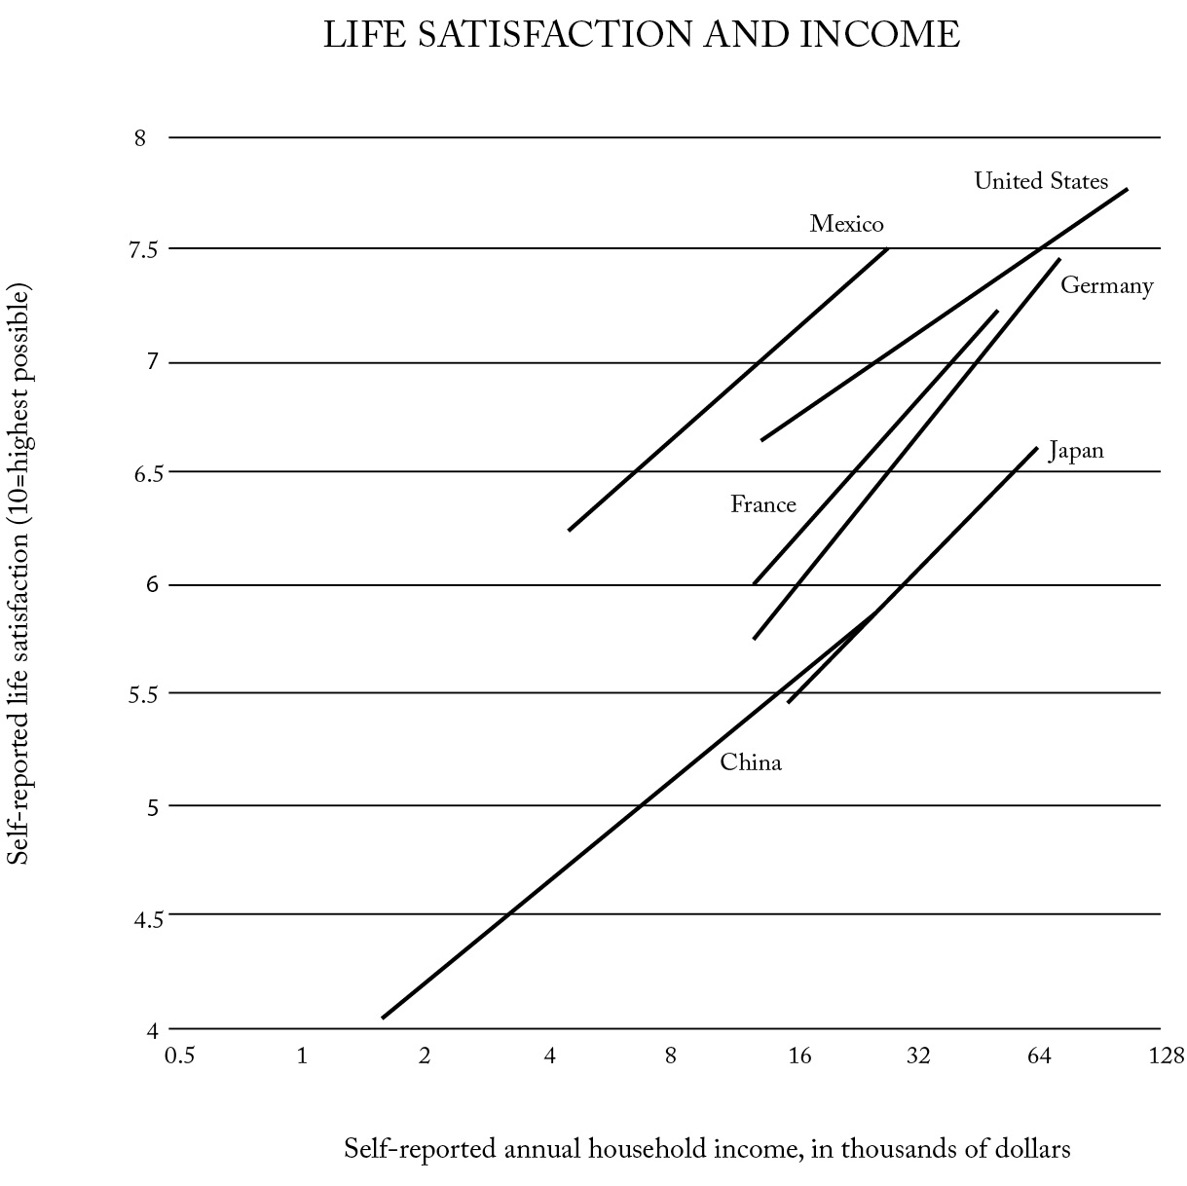
Source: Betsey Stevenson and Justin Wolfers
The vertical axis of this graph represents self-reported well-being. Those interviewed had to say how satisfied they were with their lives on a scale from 0 to 10. Rating yourself at 10 means you consider yourself maximally happy: you think that, realistically, life couldn’t get any better. Rating yourself at 0 means you consider yourself maximally unhappy: you think that, realistically, life couldn’t get any worse. Most people fall in the middle of this range. The horizontal axis represents annual income.
What’s interesting about this graph is that a doubling of income will always increase reported subjective well-being by the same amount. For someone earning $1,000 per year, a $1,000 pay rise generates the same increase in happiness as a $2,000 pay rise for someone earning $2,000 per year, or an $80,000 pay rise for someone already earning $80,000 per year. And so on.
This graph allows us to determine just how much greater a benefit the extreme poor receive from one dollar than you or I do. Imagine if your boss called you into her office and told you your salary would double for the next year. You’d be pretty pleased, right? What the conclusions from the economic studies [Note how a single paper morphed into “economic studies” — Alexey] suggest is that the benefit you get from having your salary doubled is the same as the benefit an extremely poor Indian farmer gets from having his salary doubled. If you’re on the typical US wage of $28,000 per year, the benefit you’d get from an additional $28,000 in income is the same as the benefit a poor Indian farmer would get from an additional $220.
This gives us a good theoretical reason for thinking that the same amount of money can do one hundred times as much to benefit the very poorest people in the world as it can to benefit typical citizens of the United States. If you earn as much as the typical American worker, then you are one hundred times as rich as the very poorest people in the world, which means additional income can do a hundred times as much to benefit the extreme poor as it can to benefit you or me. This isn’t to say that income is all that matters to well-being—of course other factors like safety and political freedom are involved. But income certainly plays a critical role in how enjoyable, long, and healthy your life is. Looking at how much we can benefit people via increasing their income gives us a particularly robust way of assessing how much we can benefit others compared to ourselves.
It’s not often you have two options, one of which is one hundred times better than the other. Imagine a happy hour where you could either buy yourself a beer for five dollars or buy someone else a beer for five cents. If that were the case, we’d probably be pretty generous—next round’s on me! But that’s effectively the situation we’re in all the time. It’s like a 99-percent-off sale, or getting 10,000 percent extra free. It might be the most amazing deal you’ll see in your life.
This idea is important enough that I’ve given it a name. I call it the 100x Multiplier. For those of us living in rich countries, you should expect to be able to do at least one hundred times as much to benefit other people as you can to benefit yourself. [emphasis mine]
Here’s the paper MacAskill cites.
Consider the following argument Adapted from Westfall and Yarkoni, 2016 :
The sales of ice cream are positively correlated with temperature outside, thus to raise temperature outside we need to increase ice cream sales.
What’s the difference between the argument above and the argument below?
The income is positively correlated with happiness, thus to raise happiness we need to increase income.
The difference between the arguments is that the first is obviously false and the second is obviously true. That’s the initial impression at least. In reality, the second argument seems right because its conclusion is intuitively right. When we evaluate it, we think “well, obviously income increases happiness!” and we completely forget about the premise and that the structure of the argument is “X is correlated with Y, therefore X causes Y”. In fact, later in the book, MacAskill makes the same exact point:
Of course, correlation is not causation. Merely showing that the people’s welfare has improved at the same time the West has been offering aid does not prove that aid caused the improvement. It could be that aid is entirely incidental, or even harmful, holding back even greater progress that would have happened anyway or otherwise.
So MacAskill agrees that his argument about the causal relationship between life satisfaction and income is invalid. It seems that Stevenson and Wolfers agree as well, since they never claimed to demonstrate the causal relationship with this graph alone.
Therefore, I conclude that MacAskill knew that this argument is a misrepresentation of Stevenson and Wolfers but wrote it anyway.
Jobs that make a difference
MacAskill:
Indeed, medicine is the banner career for people who want to make a difference. Every year, about twenty thousand people in the United States and eight thousand people in the United Kingdom go to medical school, and the number is growing year after year. Even for those for whom medicine isn’t a good fit, the desire to pursue a career that makes a difference is widespread. According to one study, 70 percent of young people regard ethical considerations as “crucial” in their choice of employer. Enterprises like Teach for America have grown dramatically, explicitly targeting students who care more about making a difference than about making a high salary. Organizations like Net Impact, Idealist, and ethicalcareers.org all offer advice on choosing a vocation that does good. Even Oprah Winfrey, on her website, provides examples of “jobs that make a difference.”
So, MacAskill uses the 70% number as evidence of people desiring to pursue a career that makes a difference. Now, look at the source article:
Over 70% of students said that a company’s ethical track record is a crucial factor when choosing their employer.
It has nothing to do with “making a difference”.
Benefits from medicine in the US
(this seems to be just a mistake)
MacAskill:
Greg found work by an epidemiologist named John Bunker, who estimated that the total benefits from medicine in the United States is about 7 QALYs per person
MacAskill cites “The Role of Medical Care in Contributing to Health Improvements within Societies,” International Journal of Epidemiology 30, no. 6 (December 2001), 1,260–3.. The paper contains no such estimate.
Appendix
MacAskill:
With the help of collaborators, Kremer tested the different ICS programs one by one. First, he looked at the efficacy of providing schools with additional textbooks. Classrooms would often have only one textbook for a class of thirty, so it seemed obvious that providing more textbooks would help students learn. However, when Kremer tested this theory by comparing test scores between schools that received books and those that didn’t, he found no effect for all but the most high-achieving of students. (He suggests the textbooks were written at too high a level for the children, especially considering they were in English, the pupils’ third language after Swahili and their local languages.)
Next, Kremer looked at providing flip charts. The schoolchildren couldn’t understand the textbooks, but having flip charts would allow teachers to tailor lessons to the specific needs of the students. Perhaps these would work better. Again, however, no effect.
Undaunted, he took a different approach. If providing additional materials didn’t work, maybe increasing the number of teachers would. After all, most schools had only one teacher, catering to a large class. But, again, he found no discernible improvement from decreasing class sizes.
Over and over again, Kremer found that seemingly obvious programs to improve education just weren’t working. But he persisted. He refused to believe there was simply no way to improve the education of children in Kenya. At that point, a friend at the World Bank suggested he test deworming.
Few people in developed countries know about intestinal worms: parasitic infections that affect more than one billion people worldwide. They aren’t as dramatic as AIDS or cancer or malaria, because they don’t kill nearly as many people as those other conditions. But they do make children sick, and can be cured for pennies: off-patent drugs, developed in the 1950s, can be distributed through schools and administered by teachers, and will cure children of intestinal worms for a year.
Kremer did an experiment to see whether treating children for these intestinal worms had an impact on education. The results were striking. “We didn’t expect deworming to be as effective as it was,” Kremer told me. “It turned out to be one of the most cost-effective ways of increasing school participation.”
Absenteeism is a chronic problem in schools in Kenya, and deworming reduced it by 25 percent. In fact, every child treated spent an extra two weeks in school, and every one hundred dollars spent on the program provided a total of ten years of additional school attendance among all students. Enabling a child to spend an extra day in school therefore cost just five cents. It wasn’t merely that deworming children “worked” at getting children into school. It worked incredibly well.
What’s more, deworming didn’t merely have educational benefits. It had health and economic benefits, too. Intestinal worms can cause a variety of maladies, including anemia, intestinal obstruction, and a suppressed immune system that can increase the risk of other diseases like malaria. Deworming decreases all these risks.
Moreover, when Kremer’s colleagues followed up with the children ten years later, those who had been dewormed were working an extra 3.4 hours per week and earning an extra 20 percent of income compared to those who had not been dewormed. In fact, deworming was such a powerful program that it paid for itself through increased tax revenue.
By the time his work on deworming was published, Kremer’s revolutionary new approach to development had spawned a following, with dozens of the brightest young economists running hundreds of trials of different development programs. Meanwhile, Glennerster had quit her job and become the executive director of the newly founded Poverty Action Lab at MIT, where she used her knowledge of policy to ensure the research Kremer and his colleagues were conducting would have real-world impact.
In 2007, on the basis of this research, Kremer and Glennerster cofounded the nonprofit Deworm the World Initiative, which provides technical assistance to the governments of developing countries, enabling them to launch their own deworming programs. The charity has provided more than forty million deworming treatments, and the independent charity evaluator GiveWell regards them as one of the most cost-effective development charities.