Issues with Bloom et al's "Are Ideas Getting Harder to Find?" and why total factor productivity should never be used as a measure of innovation
created: ; modified:Authors: Alexey Guzey, Eigil Rischel, Applied Divinity Studies, Anonymous, Anonymous
Note: A response to this essay from Nicholas Bloom, Charles I. Jones, John Van Reenen, and Michael Webb we received prior to the publication can be read in Appendix A.
Introduction
Is scientific and technological progress becoming harder and harder to achieve? This question has been in the focus of the recently founded field of Progress Studies and it has been approached from a variety of perspectives, including by Patrick Collison & Michael Nielsen (a) and Scott Alexander (a).
However, the paper that influenced the discourse around this question the most is Are Ideas Getting Harder to Find? (pdf, a), written by Nicholas Bloom, Charles Jones, John Van Reenen, and Michael Webb. Bloom N, Jones CI, Van Reenen J, Webb M. Are ideas getting harder to find?. American Economic Review. 2020 Apr;110(4):1104-44.
The paper’s first working version was publicized in late 2016 and it was formally published in American Economic Review in April 2020. In addition to serving as a seminal work for Progress Studies, Bloom et al has been very influential for economists at large, having been cited more than 560 times in less than 5 years.
Bloom et al’s main contribution to the literature comes from the paper’s three in-depth case studies that examine idea production and research productivity in three narrow areas of research: Bloom et al: “we think [that] looking at the macrodata is insufficient and … studying the idea production function at the micro level is crucial. … The aggregate evidence … may tell us nothing about research productivity at the micro level. Hence, the contribution of this paper: study the idea production function at the micro level to see directly what is happening to research productivity there.”
- In the Moore’s Law case study, Bloom et al investigate progress in the number of transistors on a microprocessor
- In the agriculture case study, Bloom et al investigate progress in increasing yields of several crops
- In the medical research case study, Bloom et al investigate progress in increasing life expectancy and look at several specific diseases
Bloom et al wield this impressive collection of data to arrive at the conclusion that ideas are getting harder to find:
The number of researchers required today to achieve the famous doubling of computer chip density is more than 18 times larger than the number required in the early 1970s. More generally, everywhere we look we find that ideas, and the exponential growth they imply, are getting harder to find … the [US] economy has to double its research efforts every 13 years just to maintain the same overall rate of economic growth.
Despite Bloom et al’s sweeping conclusions, we find that the paper fails to provide adequate evidence for many of its key claims.
This essay is structured as follows.
- We show that Bloom et al define what an idea is in inconsistent and contradictory ways, resulting in the conclusion that ideas are getting harder to find regardless of the actual observed pace of progress.
- We show that Bloom et al believe that their Moore’s Law case study and other case studies are irrelevant to the bigger “are ideas getting harder to find?” question anyway (and so do we).
- We show that Bloom et al’s aggregate data fails to compellingly address the question “are ideas getting harder to find?” due to Bloom et al’s reliance on total factor productivity (TFP) as a measure of innovation. TFP is a terrible measure of innovation.
- We show that Bloom et al appear to not realize that most of the data they analyze in the paper, including the US TFP, does not exhibit exponential growth.
- We show that Bloom et al’s Moore’s Law case study results are simply not robust.
- We share our perspective on the question “are ideas getting harder to find?”
- We discuss what Bloom et al does show and explain the context behind the debate between Jones and Romer
- We summarize the takeaways from our essay for economists.
- We conclude the essay by sharing our larger perspective on the paper.
While this essay is focused exclusively on this one paper, we have no evidence that Bloom et al is any less rigorous than a typical growth economics paper and, in fact, given the publication venue and the authors, there’s every reason to expect it to be uniquely methodologically robust.
Bloom et al define what an idea is in inconsistent and contradictory ways, resulting in the conclusion that ideas are getting harder to find regardless of the actual observed pace of progress.
In this section, we will show that:
- Bloom et al. have a mathematical abstraction in mind when they talk about “ideas”. It does not necessarily correspond to any normal understanding of an idea.
- Bloom et al switch the way they define “ideas” without any apparent principle, from case study to case study.
- Since Bloom et al do not follow any consistent way of defining “ideas”, one cannot compare their results between each other and conclude that “everywhere we look we find that ideas … are getting harder to find”.
Bloom et al. have a mathematical abstraction in mind when they talk about “ideas”. It does not necessarily correspond to any normal understanding of an idea
Bloom et al “measure the output of the idea production for Moore’s Law as a stable 35 percent per year” i.e. they find that the number of ideas that kept Moore’s Law going between 1971 and 2014 has not changed. How exactly do they do this?
First, Bloom et al state Moore’s Law as follows:
the number of transistors packed onto an integrated circuit serving as the central processing unit for a computer doubles approximately every two years.
Bloom et al assume that the number of transistors on an integrated circuit (on a chip) is increased by Moore’s Law ideas. Those ideas, in turn, are produced by researchers working with some research productivity.
Thus, Moore’s Law idea output per year is modeled as follows:
$$ \text{Idea Output (per year)} = \text{Number of Researchers} \times \text{Research Productivity} $$
Since we have the data on the yearly change in the number of transistors on a chip, we can try to estimate the number of ideas produced by researchers every year. But how? It depends on the precise connection between ideas and transistors. Does each idea lead to a % (exponential) increase in the number of transistors? Quadratic increase? Linear increase? Sublinear increase?
Figure 1. Microprocessor transistor counts 1971-2011 & Moore's Law image used by Bloom et al. Copied from Wikipedia. Archive by Internet Archive.
All of these possibilities seem a priori reasonable:
- exponential idea: a way to improve the architecture of a transistor that allows you to use 10% fewer components for a single transistor, decreasing its area by 10%, and allowing 1/0.9=11% more transistors to fit on a chip of a given size
- quadratic idea: a way apply novel coating to all surfaces of the transistor, which allows to shave off some fixed amount of the original material on each side of the transistor. This idea would decrease both length and width of the transistor linearly, meaning that the number of transistors that could be fit in a given area would increase quadratically
- linear idea: a way to change the alloy used on some specific surface of the transistor that spans its side to a thinner but otherwise equivalent alloy. In this case, transistor density on a chip would increase linearly
- sublinear idea: the linear idea above, except that the new alloy makes each transistor leak some electricity in a way that doesn’t matter when the number of transistors on a chip is small but which starts to negatively affect the chip when the number of transistors on a chip increases
Thus, even though economists are used to exponential growth being the default when studying entire economies, when we study Moore’s Law ideas, we need to think about their shape very carefully. Bloom et al agree that it’s not a priori obvious that ideas are exponential, writing:
Relating Ȧ_t / A_t to ideas runs into the familiar problem that ideas are hard to measure. Even as simple a question as “What are the units of ideas?” is troublesome.
Suppose each idea increases the number of transistors by a fixed amount. Given that the number of transistors on a chip was growing 1,155,546 times faster in 2014 than in 1971, while the number of researchers increased just 18 times, this works out to a 64,197x increase in research productivity between 1971 and 2014.
On the other hand, suppose each idea increases the number of transistors by a fixed percentage. Given that the number of researchers increased 18 times, but percentage growth stayed constant, this works out to an 18x decrease in research productivity between 1971 and 2014.
That is, the conclusion of the case study hinges on the choice of the functional form of an “idea”.
Further, note that both of the scenarios above result in the same exponential growth in the number of transistors. In other words, based just an exponential curve for the number of transistors we cannot distinguish between the exponential flow of linear ideas and between a linear flow of exponential ideas:
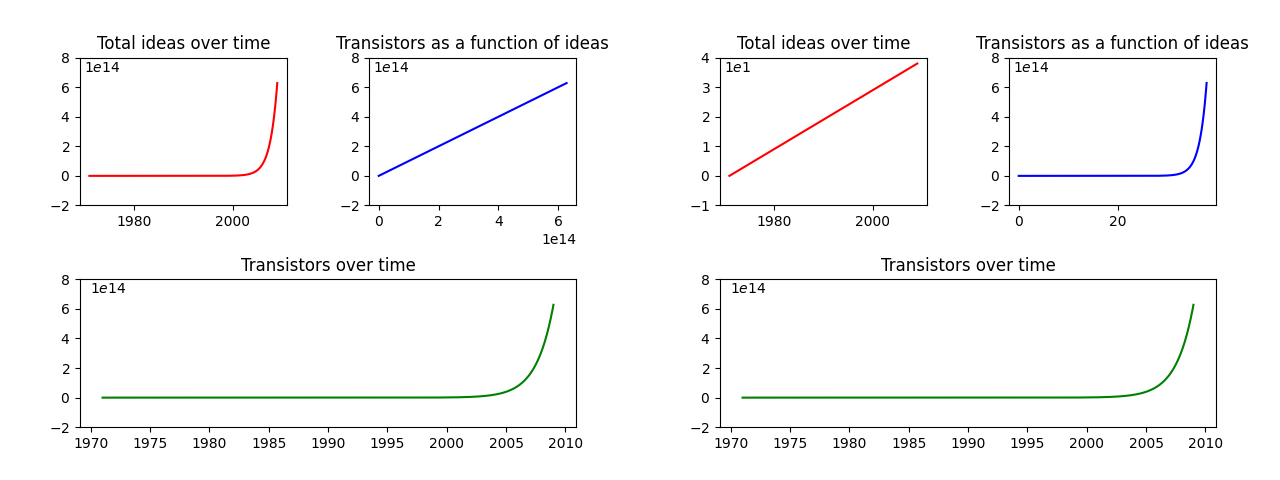
Figure 2. Examples of potential relationships between the number of ideas and the number of transistors, depending on the flow and on the form of ideas.
So how do Bloom et al answer the “troublesome” question of the right unit of a Moore’s Law-relevant idea? In section The Conceptual Framework, they write:
We follow much of the literature … and define ideas to be in units so that a constant flow of new ideas leads to constant exponential growth in A … However, this is clearly just a convenient definition, and in some ways a more accurate title for this paper would be “Is Exponential Growth Getting Harder to Achieve?” [emphasis in this quote and in all quotes below ours]
Bloom et al “follow much of the literature”, pick “a convenient definition”, and proceed to define “ideas” as something that leads to exponential growth, avoiding all of the questions about the functional form we discussed above, never giving an example of what they consider to be an idea, and never explaining whether their abstract conception of an “idea” has any correspondence with something that a non-academic would understand by the word.
And this would be totally reasonable if the paper was written solely for other growth economists who know that an “idea” is just something that leads to exponential growth, nothing more, nothing less. But this is not what Bloom et al are doing.
For example, in a piece titled Great Ideas Are Getting Harder to Find (a) published in MIT Sloan Management Review, Bloom, Jones, Van Reenen, and Webb write:
Our latest research shows encouraging signs that new concepts have not been depleted. However, unique, original, and untapped ideas are getting more expensive to find — and that’s a problem.
In that piece, Bloom et al write about ideas, effective number of researchers, and research productivity as if those terms do not need any additional explanations in a non-academic publication and they never explain the assumptions they make or the technical nature of the terms they use.
Such claims by Bloom et al are unjustified and have no connection to the work done in the paper, which studies an abstract growth economics concept, not “unique, original, and untapped ideas”.
Actually, that’s not right. It turns out that,
In the medical research section, Bloom et al change the procedure of defining what an “idea” to a completely different one that contradicts the procedure they previously claimed to follow
Now let’s take a look at the medical research portion of the paper. Bloom et al model medical idea output in the same way they modeled Moore’s Law idea output:
$$ \text{Idea Output} = \text{Number of Researchers} \times \text{Research Productivity} $$
But now the measure of idea output is life expectancy. Specifically, Bloom et al try to estimate how many “years of life” were saved by reductions in the mortality rate of various diseases, e.g. cancer.
In the abstract, Bloom et al wrote that all ideas imply exponential growth. Bloom et al: “everywhere we look we find that ideas, and the exponential growth they imply, are getting harder to find.” We would therefore expect them to continue to follow the exponential functional form of an idea used in Moore’s Law case study.
Confirming this, throughout the paper Bloom et al repeatedly state that a constant flow of medical ideas leads to constant exponential growth. For example:
The evidence presented in this paper concerns the extent to which a constant level of research effort can generate constant exponential growth, either in the economy as a whole or within relatively narrow categories, such as a firm or a seed type or a health condition.
The right notion of exponential growth here is the percentage growth in life expectancy caused by the drop in the mortality due to e.g. cancer.
Medical idea output measured in exponential terms has grown by roughly a factor of 2.2, while the number of researchers has grown by a factor of 4.2, meaning their research productivity has dropped by 4.2/2.2 = 1.9 times.
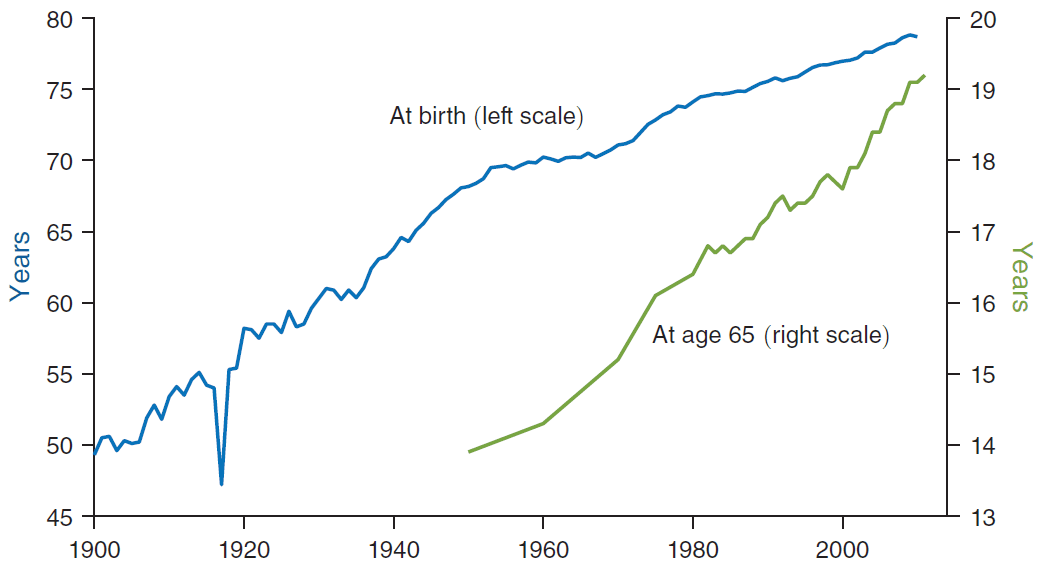
Figure 3. United States life expectancy. Copied from Bloom et al 2020.
It turns out that, despite writing that ideas lead to exponential growth in the abstract of the paper, then in the introduction of the paper, then in the methods section, and then twice explicitly confirming that medical ideas are exponential, Bloom et al do not actually use this definition when studying health conditions. Here’s what Bloom et al actually do:
Steady linear increases in life expectancy, not exponential ones, seem to be the norm. For this reason, we use “years of life saved,” that is, the change in life expectancy rather than its growth rate, as a measure of idea output.
Bloom et al decide to define ideas based on the historical pace of medical progress.
Therefore, Bloom et al find that the research productivity for various types of cancer and for heart disease decreased by factors between 1.2 and 25.3. Bloom et al’s Table 3.
Although Bloom et al write that “steady linear increases in life expectancy” are the norm, it doesn’t seem that life expectancy actually increases linearly. Looking closer at Figure 3, you can notice that there is a clear break in the trendline around year 1950. It turns out that between 1900 and 1949 life expectancy was growing at an average of 0.38 years per year, while between 1950 and 2010 it was growing at just 0.18 years per year: more than 2x difference. life-expectancy-log-vs-linear-ideas-guzey.xlsx
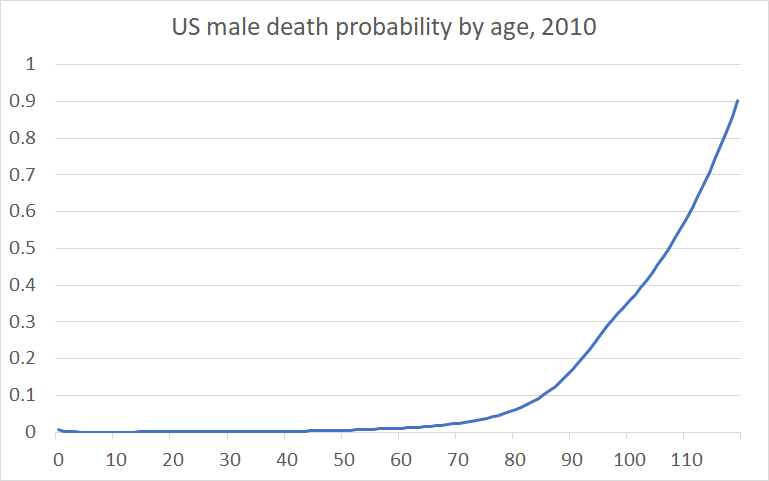
Further, since the probability of dying in a given year grows superlinearly (Figure 4), it seems that adding an extra year of life should take more ideas, not less, as you go, and assuming that life expectancy is the natural logarithm of the number of ideas seems much more reasonable.
Had Bloom et al assumed that ideas here are logarithmic, with the natural log base, they would have found a 1.2x increase in the research productivity of these researchers between 1975 and 2006.
Let’s recall that the title of the paper was “Are Ideas Getting Harder to Find?”. Earlier, Bloom et al replaced this question with “is exponential growth getting harder to achieve?” and now they seem to have replaced it with “is exponential growth getting harder to achieve in semiconductors and is linear growth getting harder to achieve in medicine?”.
Bloom et al never explain why they abandon their principled way of defining an “idea” by following the literature and decide to instead define what a medical “idea” is, based on the historical pace of progress in life expectancy.
By defining what an idea is based on the historical pace of progress, Bloom et al make their research productivity estimates depend exclusively on the number of researchers, with the rate of progress having no ability affect their conclusions
Suppose that the number of medical researchers was increasing so fast that life expectancy was growing exponentially rather than linearly. Then, Bloom et al would have written:
Steady exponential increases in life expectancy, not linear ones, seem to be the norm. For this reason, we use “relative number of years of life saved” that is, the growth rate of life expectancy rather than its change, as a measure of idea output.
Rather than seeing the linear increase in life expectancy and writing:
Steady linear increases in life expectancy, not exponential ones, seem to be the norm. For this reason, we use “years of life saved,” that is, the change in life expectancy rather than its growth rate, as a measure of idea output.
Importantly, in both cases, Bloom et al would have found that the number of ideas produced per year stayed roughly the same. A constant flow of exponential ideas leads to exponential growth and the same constant flow of linear ideas leads to linear growth.
Bloom et al ensure that the number of ideas produced per year does not significantly change, regardless of the pace of progress.
What effect does this have on research productivity?
$$ \text{Idea Output} = \text{Number of Researchers} \times \text{Research Productivity} $$
Given that Bloom et al fix idea output per year, changes in research productivity have to exactly counterbalance changes in the number of researchers. If the number of researchers increased – their productivity has decreased; if the number of researchers decreased – their productivity has increased.
By defining what an idea is based on the historical pace of progress, Bloom et al make their research productivity estimates depend exclusively on the number of researchers, with the observed pace of progress having no ability to influence their conclusions.
Bloom et al never study the question “are ideas getting harder to find?” and the different ways of defining the term “idea” they use between case studies mean that the conclusions of these case studies are incomparable between each other
So far we’ve seen Bloom et al use two inconsistent ways of defining ideas.
On the one hand, one could define ideas in terms of exponential growth and write a paper titled “Is exponential growth getting harder to achieve?”. This would be a reasonable thing to do.
On the other hand, one could define ideas based on the historical pace of progress, and write a paper called “Is the historical pace of progress getting harder to maintain?”. This would also be a reasonable thing to do. It doesn’t seem like Bloom are using this definition in general – that’s not what they claim to do and, although they switch to linear ideas based on the “linear” graph of life expectancy, they do not switch to linear ideas in their agriculture case study despite the fact that all of the crops in their dataset were growing linearly, and instead use exponential ideas there.
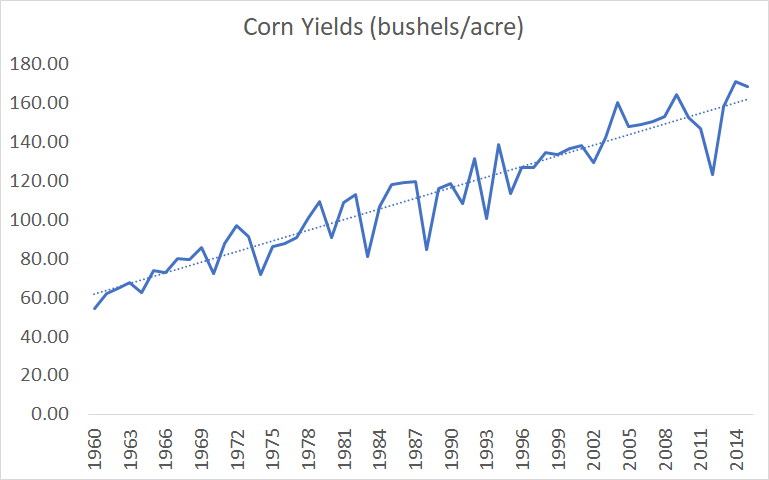
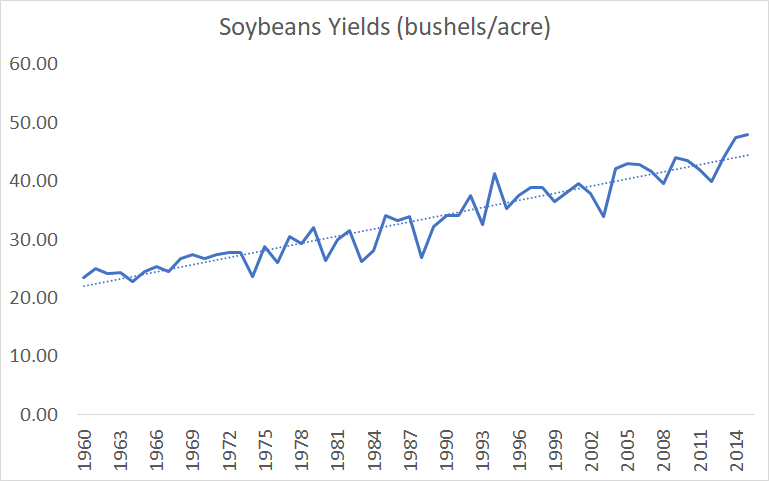
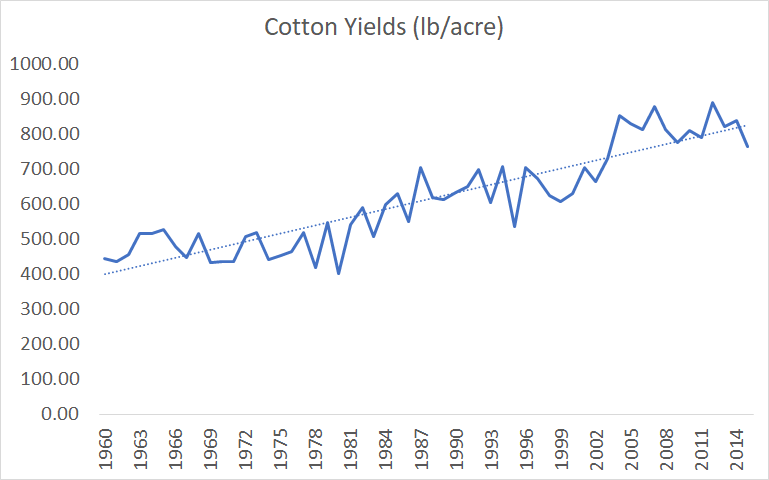
Figure 5. Bloom et al's crop yield data. Based on supplementary files to Bloom et al, Seeds/Seed data v6.xlsx, Sheet "export"
Bloom et al are aware of yields growing linearly, since they plot out the graphs and use linear interpolation for the missing data, Supplementary files to Bloom et al, IdeaPFDataAppendix.pdf, pages 9-10. but never explain why they went with the exponential functional form of agriculture ideas.
What makes all of this even worse, is the fact that Bloom et al specifically highlight the fact that they provide “detailed microeconomic evidence on idea production functions” and “a conceptually consistent accounting approach” in the paper’s introduction:
We document qualitatively similar results throughout the US economy, providing detailed microeconomic evidence on idea production functions … the paper uses a conceptually consistent accounting approach across these layers, one derived from core models in the growth literature.
Neither of the approaches Bloom et al use can really be said to be “wrong” per se – they are just different ways of defining ideas (although one should be clear that the term “idea” refers to some technical abstraction, and not to any concrete ideas people come up with) that answer different questions about what it is that’s getting harder. But, using different procedures to arrive at the definition of an idea between case studies, you can’t claim that you use “a conceptually consistent accounting approach”, compare the results between them, and claim that ideas are getting harder to find everywhere you look.
The thing one also could do – and what one might think Bloom et al did, based on the paper’s title – is to actually engage with each domain under consideration. Instead of defining ideas in terms of exponential growth or in terms of the historical pace of progress, one could actually study the field of semiconductor or cancer research, understand how ideas work, and see if they’re getting harder to find. Then one could repeat this exercise for other fields.
And if in each case one found that ideas were getting harder to find, one could write a paper that would be called “Are Ideas Getting Harder to Find?” and write “everywhere we look we find that ideas are getting harder to find”.
Finally, due to Bloom et al arbitrarily switching between exponential and linear ideas, we can conclude that one can get any result one wants by choosing an “appropriate” functional form. Had Bloom et al used the linear functional form for an “idea” in their Moore’s Law case study, they would have found that semiconductor ideas are getting easier to find. Had Bloom et al used the logarithmic functional form for an “idea” in their medical research case study, they would have found that medical ideas are getting easier to find.
Bloom et al believe that their Moore’s Law case study and other case studies are irrelevant to the bigger “are ideas getting harder to find?” question anyway (and so do we)
Setting aside the issues with the case studies presented by Bloom et al, can they even hypothetically tell us whether a constant level of research effort can generate constant exponential growth or whether ideas are getting harder to find?
Well, had Bloom et al lived 100 or 200 years earlier, then, instead of looking at transistors they would’ve been forced to study progress in mechanical gears or electromechanical relays or vacuum tubes. But that would not tell us whether a constant level of research effort can generate constant exponential growth or whether ideas are getting harder to find in general.
First, because there’s no evidence that there was ever an exponential growth in the number of mechanical gears or electromechanical relays or vacuum tubes. Second, because nobody knew in advance whether transistors would appear and revolutionize computing, obsoleting all previous developments.
In fact, it might very well be the case that, while finding that within narrowly defined categories ideas are getting harder to find, new ideas in general are getting easier to find over time, since we can now use all of the technology we invented previously and all of the scientific knowledge we collected to help us find them.
Bloom et al are aware of this problem and consider it seriously. However, instead of defending the relevance of the data from case studies – which they parade in the abstract of the paper – for the question “are ideas getting harder to find?” Bloom et al simply fall back on aggregate data (TFP):
Perhaps research productivity is declining sharply within particular cases and yet not declining for the economy as a whole. While existing varieties run into diminishing returns, perhaps new varieties are always being invented to stave this off. We consider this possibility by taking it to the extreme. Suppose each variety has a productivity that cannot be improved at all, and instead aggregate growth proceeds entirely by inventing new varieties. To examine this case, we consider research productivity for the economy as a whole.
Further, in an interview (a) to Tyler Cowen, Nicholas Bloom says:
it seems pretty obvious that individual areas are going to slow down [here, by “slowing down” Bloom means that ideas are getting harder to find]. So, the wheel was a fantastic innovation, but at some point, as progress slows down, and the horse and cart, corn yields. You can just go through innovation after innovation. They’re incredibly important, but at some point, of course, progress in those areas slows down. … The question is, are there enough new fields that are coming into being to offset that?
Confirming that Bloom et al do not believe that the evidence from individual case studies is relevant to the general questions they’re studying (and neither do we).
Q: But if Bloom et al do not believe that the evidence from individual case studies is relevant to their general questions, why do they bother studying them?
A: It appears that the main reason Bloom et al look into individual case studies is to refute the papers that defend endogenous growth theory by positing constant productivity within narrow areas of research, which Bloom et al refer to in section II.A. of the paper. Bloom et al: “Several papers, then, have proposed alternative models in which the calculations using aggregate data can be misleading about research productivity. The insight of Dinopoulos and Thompson (1998), Peretto (1998), Young (1998), and Howitt (1999) is that the aggregate evidence may be masking important heterogeneity, and that research productivity may nevertheless be constant for a significant portion of the economy. Perhaps the idea production function for individual products shows constant research productivity. The aggregate numbers may simply capture the fact that every time the economy gets larger we add more products.” For a detailed background on a long-standing academic debate between Charles Jones and proponents of endogenous growth models, see What Bloom et al does show and Is Romer right or is Jones right?.
Bloom et al measure aggregate innovation via total factor productivity (TFP). TFP should never be used as a measure of innovation
Q: Even if individual case studies do not tell us whether ideas in general are getting harder to find, we have the aggregate US total factor productivity (TFP) data. And this data shows the exact same thing. Bloom et al:
The evidence presented in this paper concerns the extent to which a constant level of research effort can generate constant exponential growth … the economy has to double its research efforts every 13 years just to maintain the same overall rate of economic growth. … research productivity is falling sharply everywhere we look … ideas are getting harder and harder to find.
A: This is correct.
TFP is an economic statistic that shows (a) how quickly the economy’s aggregate output grows compared to its aggregate input of labor and capital. If both inputs and outputs are growing at the same rate, TFP stays constant. If the output is growing quicker, TFP is increasing. If it’s growing slower, TFP is decreasing.
Bloom et al estimate total research effort of the US economy, take TFP to be a measure of research output Bloom et al: “One might question the TFP growth numbers: how much of TFP growth is due to innovation versus reallocation or declines in misallocation? One might seek to include international research in the input measure. … reasonable variations along these lines would not change the basic point: a model in which economic growth [TFP] arises from the discovery of newer and better varieties with limited possibilities for productivity growth within each variety exhibits sharply-declining research productivity.” and find that aggregate US research productivity has declined by 41 times between 1930s and 2000s (Table 7), which they interpret to mean that ideas are getting harder to find.
The problem with this conclusion is that TFP captures innovation extremely poorly and we cannot conclude anything about ideas by using TFP as a measure of research output.
For example, the US TFP did not grow in the decade between 1973 and 1982. In fact, it declined by about 2%. If – as Bloom et al claim – TFP tracks the level of innovation in the economy, we are forced to conclude that the US economy regressed technologically between 1973 and 1982.
Of course such conclusion is absurd.
Looking at the three case studies from the paper:
- The number of transistors one a chip grew from 3,500 to 134,000 between 1973 and 1982. 134,000 (Intel 80286), 3,500 (Intel 8008).
- Crop yields grew 16% between 1973 and 1982. Supplementary files to Bloom et al, Seeds/Seed data v6.xlsx, Sheet “export”: ((B42/B33)+(H42/H33)+(N42/N33)+(T42/T33))/4
- Life expectancy at birth grew 2.6 years between 1973 and 1982. 74.56-71.97=2.6 (Supplementary files to Bloom et al, Mortality/LifeExpectancy.m, lines 130 and 139).
The reason TFP has declined 1973 and 1982 despite such great technological progress (remember – there are just three statistics directly from the paper – the total sum of technological progress 1973-1982 is much greater) is that TFP is a terrible measure of innovation.
TFP is a trash can (a) statistic that tracks all sorts of factors. This is noted in a special “Note” in the readme to Bloom et al’s data: Supplementary files to Bloom et al, Aggregate/mfp_tables_historical-2017-02-17.xls sheet “Read Me”.
the productivity measures contained in this listing … do not measure the specific contribution of labor, capital, or any other single factor of production. Rather, they reflect the joint effects of many influences, including new technology, capital investment, the level of output, energy use, and managerial skills, as well as the skills and efforts of the work force.
This has also been highlighted by the large and active economic literature that has emerged in the last 20 years on the role of ‘misallocation’ in driving TFP. See Jones Jones CI. The facts of economic growth. In Handbook of macroeconomics 2016 Jan 1 (Vol. 2, pp. 3-69). Elsevier. (a) for a review.
Q: 1973-1982 is precisely the period of a unique economic crisis that occurred in the US. So while your example shows that economic fluctuations can temporarily affect TFP, you’re engaging in cherry-picking and in no way have demonstrated that TFP is not tracking innovation in general.
A: First, if TFP is expected to decline during a recession wiping out a decade of research output during which – among the other great developments – the number of transistors on a chip grew from 3,500 to 134,000, shouldn’t this be an argument against using TFP as a measure of research output? An indicator of innovation that somehow manages to show negative amounts of innovation happening despite you learning how to get 38x more transistors on a chip, increasing crop yield by 16%, increasing life expectancy by 2.6 years, etc. etc. etc. is complete garbage.
Further, if that indicator falls due to the economy experiencing a recession, independently of great technological progress, then its growth coinciding with economic growth should first be ascribed to the economy’s overall state, not technological progress.
Finally, let’s take a look at other rich countries. From the Online Appendix (a) supplied with the paper, we know that Bloom et al believe that their model applies to all OECD countries as well.
France’s TFP in 2001 was higher (a) than in 2019. Italy’s TFP in 1970 was higher (a) than in 2019. Japan’s TFP in 1990 was higher (a) than in 2009. Spain’s TFP in 1984 was higher (a) than in 2019. Sweden’s TFP in 1973 was higher (a) than in 1993. Switzerland’s TFP in 1974 was higher (a) than in 1996. United Kingdom’s TFP in 2003 was higher (a) than in 2019.
And in case you’re tempted to dismiss the data from countries like Italy and Spain by saying something like “oh of course they have problems”, note that Japan, UK, and France are all large scientific and technological powerhouses, primarily exporting high technology products (Japan (a), UK (a), France (a)), indisputably at the very frontier of humanity’s progress and recently experienced long periods of TFP stagnation.
France and the UK, for example, had lower TFP in 2019 than in 2003. As a reminder, Finding Nemo and Kill Bill were both released in 2003 and instead of streaming the movie from Netflix to your phone with a 7-inch foldable screen, 8-core CPU, and three cameras, you had to go to the movies or buy a DVD to see it.
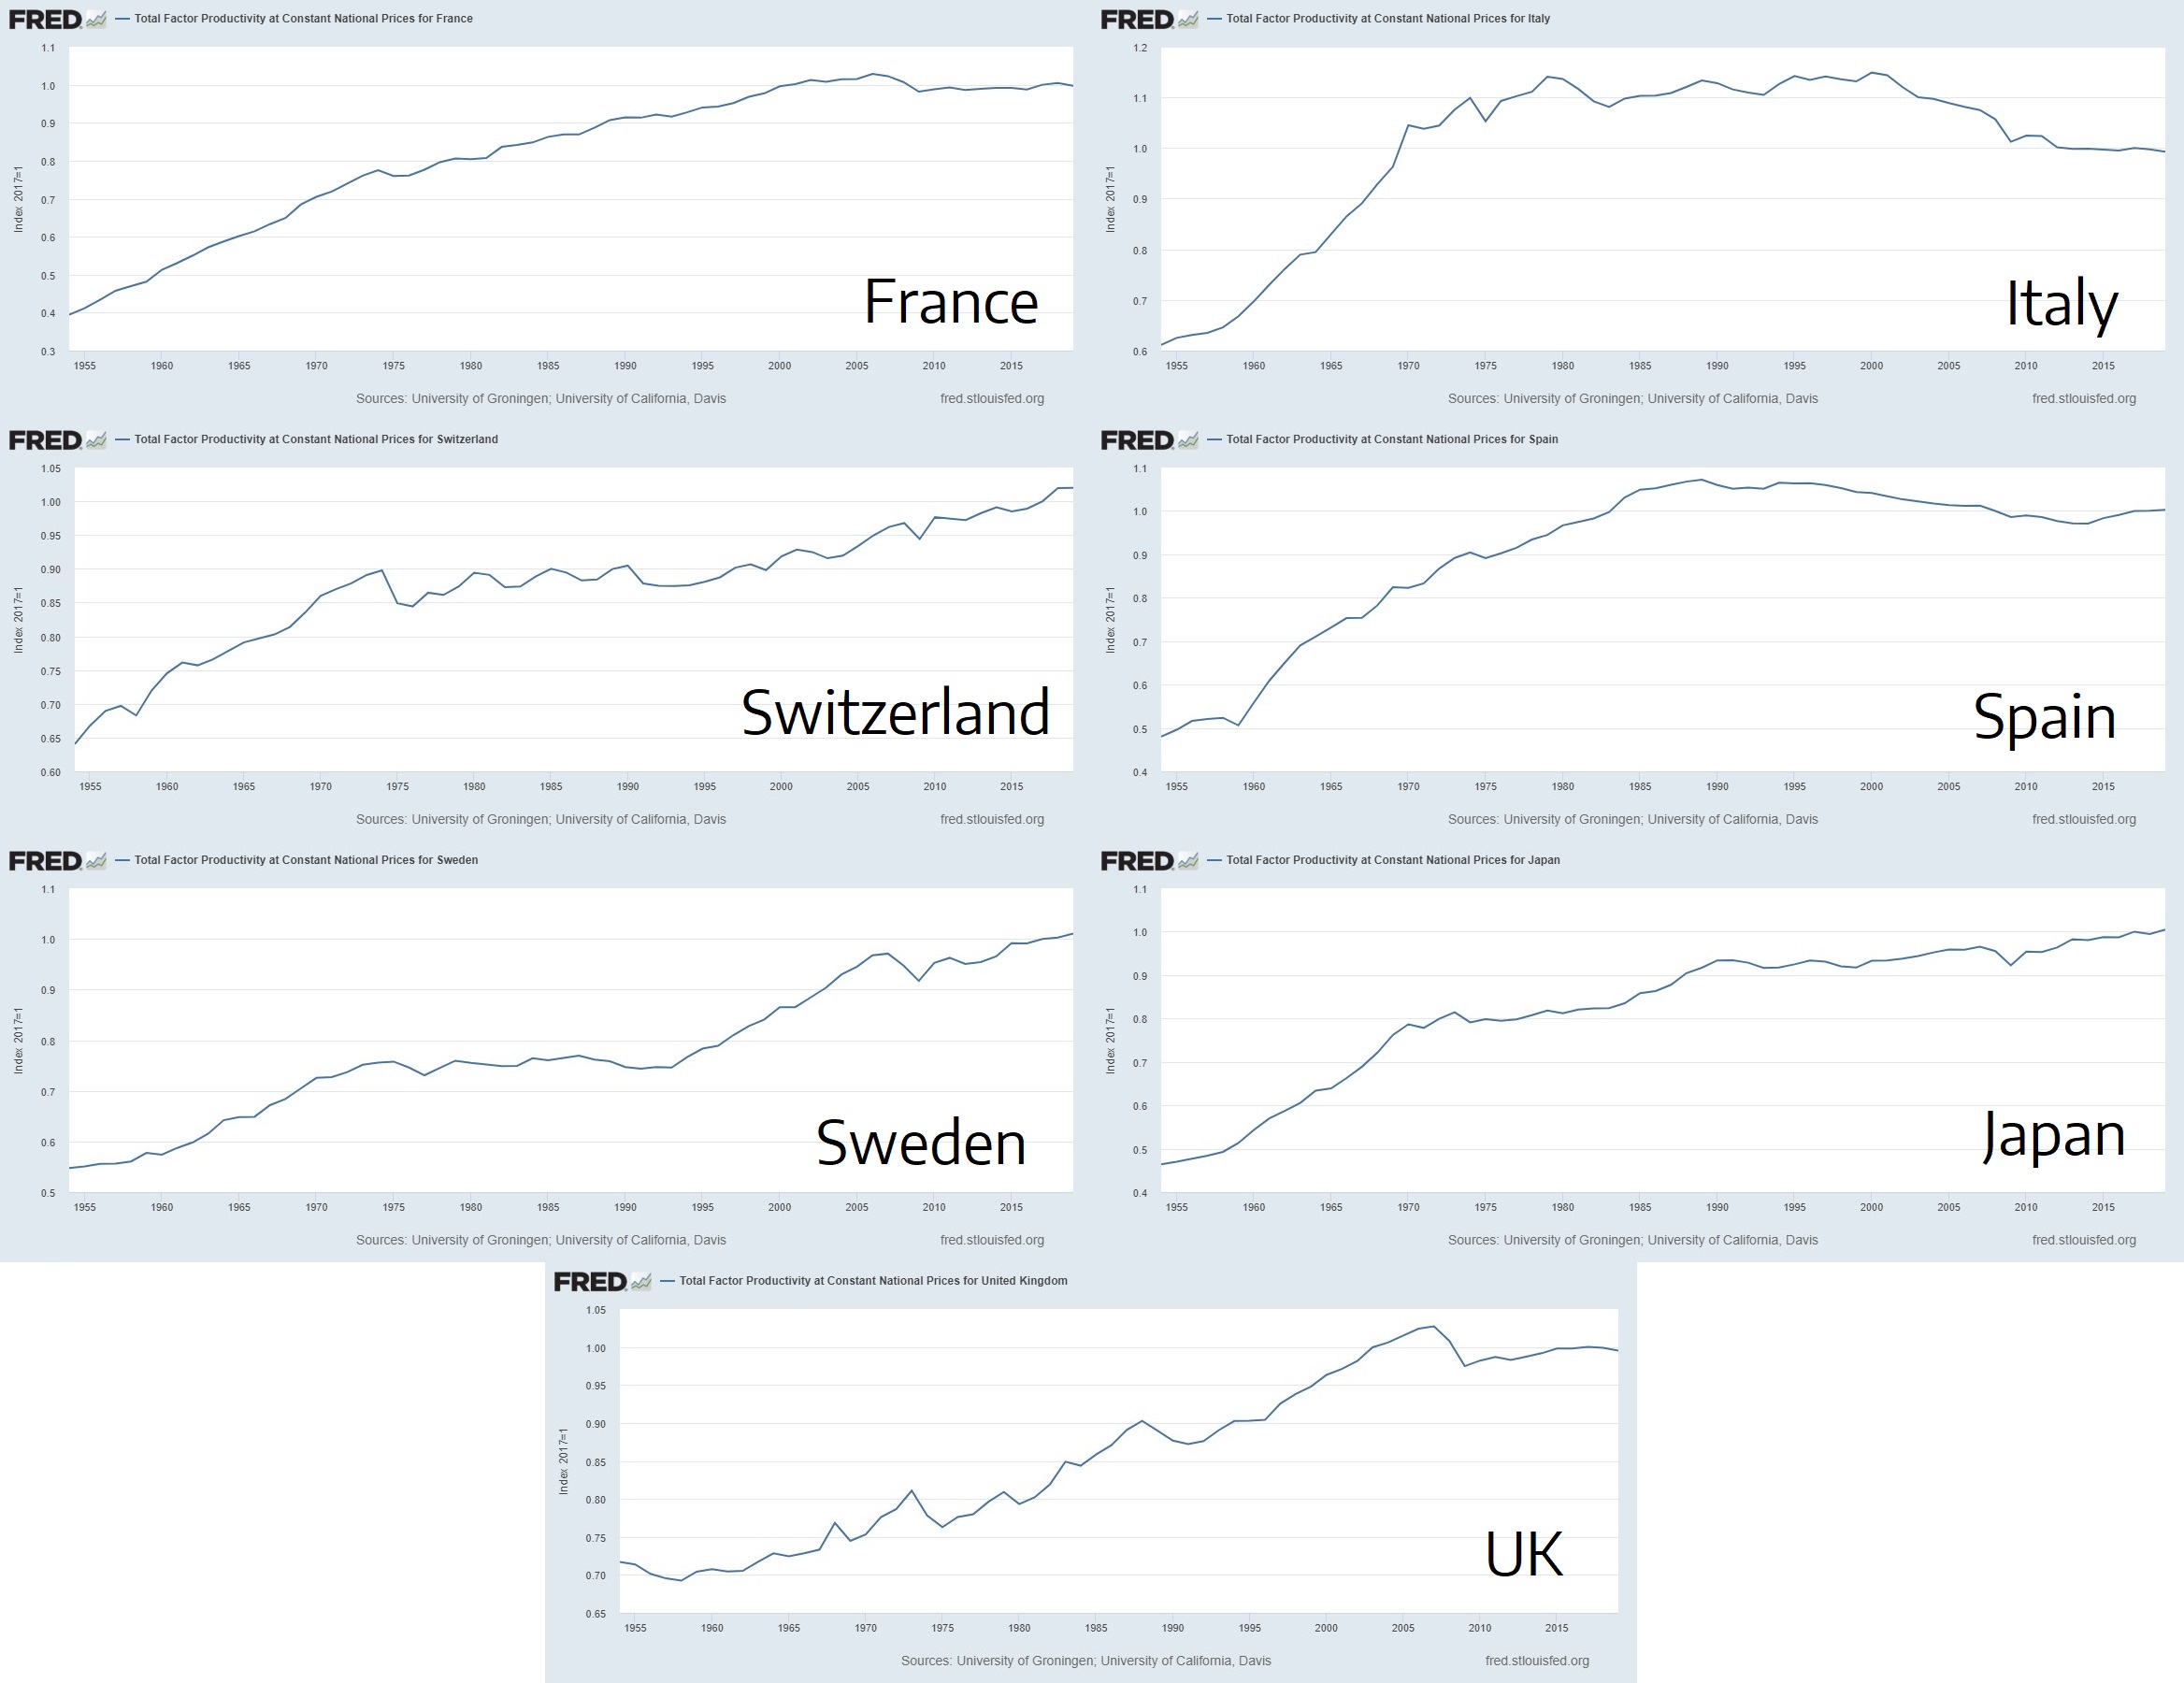
Figure 6. TFP of Italy, Japan, Spain, Sweden, Switzerland 1954-2017. Data from FRED.
Again, holding that TFP tracks innovation, we are forced to conclude that many rich, technologically advanced countries spent decades in 20th century stagnating or regressing technologically. That Japan experienced no technological advancement for more than 20 years between 1990 and 2009. That Switzerland experienced no technological advancement for more than 20 years between 1974 and 1996. And that Italy has been regressing technologically for half a century since 1970, all while its real GDP per capita doubled.
Thus, we conclude that Bloom et al’s aggregate data fails to compellingly address the question “are ideas getting harder to find?” due to their use of TFP as a measure of innovation.
Many of the most talented people today work in new sectors where their research output is either not increasing TFP or directly depressing TFP
Expanding on the point above, while Bloom et al can claim that semiconductor researchers try to increase the number of transistors on a chip, they cannot claim this to be true for researchers in the economy as a whole and TFP. Researchers and workers in the economy do not care about maximizing TFP growth and in fact sometimes innovation and new products that make the world better decrease TFP.
Does this matter quantitatively? Well, all of the OECD countries discussed above should be a very persuasive argument for this mattering quantitatively.
Further, the biggest employer of Harvard and MIT alumni is Google, followed by Microsoft and Amazon. That is, the dominating job choice of the world’s most talented people is working at a company whose main product is given away for free and is barely captured in GDP and TFP calculations, compared to the amount of value it creates.
If Google makes $5/month from you viewing ads bundled with Google Search but provides you with even just $500/month of value by giving you access to literally all of the information ever published on the internet, then economic statistics only capture 1% of the value Google Search provides.
The example of Wikipedia is even more striking. As Brynjolfsson, Eggers, and Gannamaneni note in the study Using massive online choice experiments to measure changes in well-being, Brynjolfsson E, Collis A, Eggers F. Using massive online choice experiments to measure changes in well-being. Proceedings of the National Academy of Sciences. 2019 Apr 9;116(15):7250-5. in Wikipedia’s case, GDP (and TFP) is being actively depressed by innovation:
Since the 2000s, people have increasingly flocked to Wikipedia to get information about a wide variety of topics updated in real time by volunteers. In 2012, Encyclopedia Britannica, which had been one of the most popular encyclopedias, ceased printing books after 244 years (Pepitone 2012). Wikipedia has over 60 times as many articles as Britannica had, and its accuracy has been found to be on a par with Britannica (Giles 2005). Far more people use Wikipedia than ever used Britannica – demand and well-being have presumably increased substantially. But while the revenues from Britannica sales were counted in GDP statistics, Wikipedia has virtually no revenues and therefore doesn’t contribute anything to GDP other than a few minimal costs for running servers and related activities and some voluntary contributions to cover these costs. … What’s more, many people now have digital maps, streaming music, online newspapers, and other services available for no extra cost once they are able to access the Internet on mobile devices or home computers. For such transition goods, consumer surplus increases as free access spurs demand, but revenue decreases as prices become zero (Figure 4). Hence GDP and consumer welfare actually move in opposite directions.
And as they note elsewhere in the paper:
although information goods have unquestionably become increasingly ubiquitous and important in our daily lives, the share of the information sector as a fraction of the total GDP (~ 4-5%) has not changed in the last 35 years
More generally, if more and more companies that fail to capture the consumer surplus they generate appear and employ people whose previous employers were better at capturing created value, then, all else equal, we would expect both GDP and TFP fall, even if those new companies are directly enabled by new technology.
The ultimate example of this are leisure-providing companies (VoxEU (a)): Rachel L. Leisure-enhancing technological change. Job market paper, London School of Economics. 2021.
As the range of leisure options increases, people spend more time on leisure, meaning that ever more resources are directed towards innovation in the leisure sector. This has adverse implications for the tangible economy. In particular, in the paper, I show analytically that the growth rate of knowledge, or total factor productivity (TFP), declines once the leisure sector emerges.
Bloom et al appear to not realize that most of the data they analyze in the paper, including the US TFP, does not exhibit exponential growth
How well are Bloom et al familiar with the data they analyze?
As we discussed above, the number of transistors on a chip is growing exponentially over time, while life expectancy and crop yield grow linearly.
What about the aggregate US TFP, Supplementary files to Bloom et al, Aggregate/AggregateBLSIPP_Main.log, lines 39-104, column “TFPIndex”. Bloom et al do not have the year-over-year data the for 1930s and 1940s, instead using aggregated data produced by Robert J. Gordon. discussed in the previous section, which Bloom et al characterize as growing exponentially?
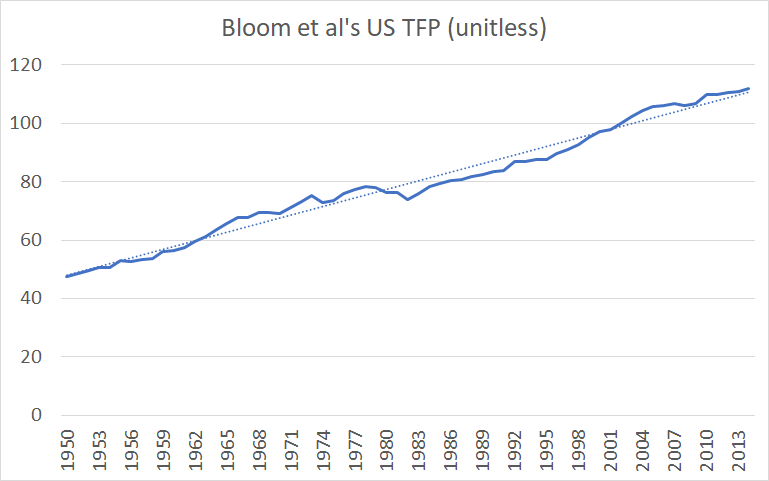
Figure 7. Bloom et al's US TFP 1950-2014.
As we can see from Bloom et al’s data, for the time period they study, the US TFP has been growing linearly, not exponentially.
Although it is tempting to assume, by default, that, since GDP per capita is growing exponentially TFP must also be growing exponentially and that the apparent linearity is the result of exponential growth often appearing linear over short enough time scales, such assumption is unwarranted: TFP is growing much slower than GDP per capita. For example: Using data from FRED.
- Between 1970 and 2019, Italy’s TFP decreased by 5%, while its real GDP per capita increased by 104%.
- Between 1970 and 2019, the US TFP increased by 33%, while its real GDP per capita increased by 143%.
- Between 1970 and 2019, China’s TFP increased by 79%, while its real GDP per capita increased by 3499%.
And although Bloom et al changed how they analyze the data upon seeing that life expectancy is growing linearly – ‘Steady linear increases in life expectancy, not exponential ones, seem to be the norm. For this reason, we use “years of life saved,” that is, the change in life expectancy rather than its growth rate, as a measure of idea output"’ – It appears that Bloom et al simply do not realize that TFP is growing linearly, thus leading them to analyze the US TFP as if it were growing exponentially and resulting in these inconsistent analyses of two linearly growing quantities.
We further note that despite Bloom et al writing that “life expectancy is one of the few economic goods that does not exhibit exponential growth” and that “relatively stable exponential growth is common in the cases we study (and in the aggregate US economy)”, out of all of Bloom et al’s case studies, the outcome measure in only one of them is growing exponentially (the number of transistors on a chip in Moore’s Law case study). The rest (including the aggregate US economy) are growing at most linearly.
| Area ⠀⠀⠀⠀⠀⠀⠀⠀⠀⠀⠀⠀⠀⠀⠀⠀⠀⠀⠀⠀⠀⠀⠀⠀⠀⠀⠀⠀⠀⠀ | Historical growth ⠀⠀⠀⠀⠀⠀⠀⠀⠀⠀⠀⠀⠀⠀⠀⠀⠀ | Bloom et al’s functional form of an idea ⠀⠀⠀⠀⠀⠀⠀⠀⠀⠀⠀⠀⠀⠀⠀⠀⠀ |
|---|---|---|
| Medicine (life expectancy) | linear (logarithmic?) | linear |
| Agriculture (yield) | linear | exponential |
| Economy (TFP) | linear | exponential |
| Moore’s Law (transistors) | exponential | exponential |
Table 1. Growth in different areas studied by Bloom et al.
Bloom et al’s Moore’s Law case study results are simply not robust
At National, Widlar kept a bottle of Jim Beam in his desk drawer, deigned to speak only to a select few people in the company, and occasionally engaged in office-destroying outbursts so prolonged and explosive that Valentine describes him as “certifiable.” But when Widlar was calm, he designed analog circuits that at one point accounted for roughly 75 percent of the worldwide market. “Bob steeled me from trying to homogenize great technical genius,” Valentine says.
Let’s get back to the Moore’s Law case study that we discussed in the beginning.
From Table 1, we can see that it is the only case study presented by Bloom et al exhibiting exponential growth. Bloom et al find that between 1971 and 2014, the number of transistors on a chip kept doubling approximately every 2 years, while the number of semiconductor researchers required to achieve that doubling increased about 18 times.
Thus, if we limit ourselves to the question of “Is Exponential Growth Getting Harder to Achieve?” for this case study, the answer is unequivocal “yes”.
Or is it?
Although it might seem that an 18 times increase in the number of semiconductor researchers required to double the number of transistors on a chip is so profound that overturning it would be exceptionally difficult, a simple back-of-the-envelope calculation that adds several major factors not included in Bloom et al’s estimate suggests that we cannot rule out such an overestimation.
To be clear, we find it implausible that the number of researchers required to double the number of transistors on a chip stayed constant between 1971 and 2014: what follows is a hypothetical exercise the purpose of which is to show that Bloom et al’s simple estimate leaves out many important factors that likely greatly affect their results and that their large effect sizes are simply not as robust as they might seem.
In fact, as we show below, they can be overturned with just four, a priori not implausible, assumptions. Thus:
- 18x->8x: discard non-semiconductor research. Only about 10% of Intel’s patents in 2010s were in semiconductors. So in the case of Intel, a more sensible estimate would exclude the vast majority of its R&D not directed to semiconductors. Similar adjustments should be made for many other big firms Bloom et al study (Nvidia, IBM, etc.).
- Bloom et al do in fact perform such an adjustment. This causes their headline estimate of the factor of 18 increase in the number of semiconductor researchers that includes all R&D of “key firms” to fall to just the factor of 8 increase (see Bloom et al’s Table 1 for more detail).
- 8x->4x: adjust for general progress in semiconductors. Since the 1970s, semiconductors have found many new uses, in addition to being used in chip transistors (e.g. solar cells; various sensors; various types of diods; other types of transistors that use different production processes; etc.). This means that the share of semiconductor patents actually relevant for increasing density of transistors on a chip has become significantly smaller than in 1970s. Suppose the number of semiconductor applications being worked on by the firms Bloom et al study increased 2 times. This means that in 2014 only one half of the semiconductor patents we adjusted for in step 1, are still relevant for our Moore’s Law case study.
- Now we have a factor of 8/2=4 increase in the number of Moore’s Law-relevant researchers
- 4x->1x: adjust for decrease in the average level of talent of semiconductor researchers. Now, suppose that ability of a typical semiconductor researcher falls from 99.75 percentile 99.25 percentile, due to the migration of extreme talent into software engineering and other “hotter” areas, decreasing the average number of ideas produced per person by 4 times,
From studies of mathematically gifted youth in the US who were followed for dozens of years, we know that those selected from top 0.25% are somewhere between 6 and 18 times more likely to achieve such STEM milestones like having a patent (6.1), receiving a STEM doctorate (18.2) or publishing a STEM publication (5.9), compared to those in selected from 0.75%-1% of the right tail of ability, which we might interpret as their comparative odds of producing an idea. Conservatively, let’s take the factor of 6 decline in the number of ideas produced moving 0.75% along level of ability and assuming linear relationship between the number of ideas and talent, we get a factor of 4 decline by moving 0.5%. See: Robertson KF, Smeets S, Lubinski D, Benbow CP. Beyond the threshold hypothesis: Even among the gifted and top math/science graduate students, cognitive abilities, vocational interests, and lifestyle preferences matter for career choice, performance, and persistence. Current Directions in Psychological Science. 2010 Dec;19(6):346-51.
See our further discussion of this issue in Appendix B.
- Now we have no change in the number of Moore’s Law-relevant researchers at all (4/4=1)
- 1x->0.5x: adjust for analyzed companies becoming older and slower. Finally, suppose that the structural factors – like aging and the bureaucratization – of the firms Bloom et al study (Bloom et al mostly study large and old firms with Intel being the single biggest influencer of their estimates) makes it twice as difficult for researchers to produce ideas and to get them pushed into production. Then, independently of any objective changes in difficulty of getting new ideas, today it would take us twice as many researchers to get the same improvements in semiconductors.
- Now we have a decrease of 50% (1/2=0.5) in the number of Moore’s Law-relevant researchers
Thus, using Bloom et al’s raw R&D data and just four, a priori not implausible, assumptions about the way semiconductor research works, we could conclude that Moore’s Law-relevant ideas have become twice as easy to find, contradicting Bloom et al’s headline 18x estimate, on the basis of which they concluded that “At least as far as semiconductors are concerned, ideas are getting harder to find”.
To conclude, while we believe it is extremely unlikely that the number of researchers or semiconductor R&D expenditures required to double the number of transistors on a chip stayed constant between 1971 and 2014, it appears that Bloom et al’s analysis of the question is simply not robust and fails to consider many important factors that cumulatively could flip the result.
Although we focused on Bloom et al’s Moore’s Law case study, we looked into all of the other case studies presented in the paper and found numerous serious issues with them. Most notably, we have found that:
- Bloom et al’s estimates of the number of researchers in all of their case studies (and in aggregate data) fail to adjust for changes in talent
- The connection between the measured research input and the increase in the measured variable in Bloom et al’s case studies is dubious
So, are ideas getting harder to find?
We really don’t know.
Unfortunately, at the moment, we simply do not have good measures of innovation that we could use to answer this question.
Joel Mokyr writes in the Wall Streel Journal (a):
Why the gloominess of so many of my colleagues? Part of the story is that economists are trained to look at aggregate statistics like GDP per capita and measure for things like “factor productivity.” These measures were designed for a steel-and-wheat economy, not one in which information and data are the most dynamic sectors. They mismeasure the contributions of innovation to the economy.
Many new goods and services are expensive to design, but once they work, they can be copied at very low or zero cost. That means they tend to contribute little to measured output even if their impact on consumer welfare is very large. Economic assessment based on aggregates such as gross domestic product will become increasingly misleading, as innovation accelerates. Dealing with altogether new goods and services was not what these numbers were designed for, despite heroic efforts by Bureau of Labor Statistics statisticians.
To appreciate just how much this matters: the biggest employers of Harvard and MIT alumni are Google, Microsoft, and Amazon, with 3002, 1,446, and 1,323 past or current employees, respectively, according to LinkedIn. All are information technology companies that changed our daily lives but which, according to the economic data, make as much relative impact on society today as the information technology companies were making in 1985.
The target audience for this essay is academic economists and software engineers with wide interests or whatever, so let’s assume your salary is $200k. Thinking really hard about this, would you rather
- have your $200k salary but give up the internet (i.e. give up virtually all indexed and searchable knowledge ever produced by humanity via Google, Sci-Hub and Libgen; give up email and social media; give up free high-quality video calls with anyone on the planet; give up StackOverflow; give up online gaming; give up econjobrumors; etc. etc.)?
- have the internet but earn the salary of “only” $100k?
If you chose the second option, then your consumer surplus from the internet is at least $100k per year. Minus the cost of internet but it is close to 0. This consumer surplus appeared over the last 30 years and is basically missing from economic statistics. What does get recorded in GDP is your payment to your internet provider, your Kindle subscription, and whatever else you’re paying for on the internet. A couple thousand dollars per year at most.
If you chose the first option, how are you going to do economics? Go to the university library, look through the journal issues present there, photocopy papers you’re interested in, and then snail mail the authors your questions?
The five co-authors of this essay all met on the internet and live in three different countries. We spend 50-90% of our waking time using the internet. For the majority of us, our careers could not even exist without it. The world before the internet is inconceivable. And almost none of this is recorded in the economic statistics because we do basic research and publish the stuff we write for free on the internet.
As Brynjolfsson, Eggers, and Gannamaneni note in the study Using massive online choice experiments to measure changes in well-being: Brynjolfsson E, Collis A, Eggers F. Using massive online choice experiments to measure changes in well-being. Proceedings of the National Academy of Sciences. 2019 Apr 9;116(15):7250-5. “the share of the information sector as a fraction of the total GDP (~ 4-5%) has not changed in the last 35 years”.
This is our economic statistics in the age of the abundance of material goods, of the internet and of zero marginal cost goods.
All of this suggests that we are really massively undermeasuring innovation.
Q: Well, you’re extremely online people, yes the internet changed your life, but the lives or the output of 99.9% of the population – ordinary office workers, service workers, etc. did not dramatically change due to the internet, so you can’t claim that GDP or TFP would’ve been 2x or 10x higher with “correct” accounting.
A: Well, if we learn how to make humans immortal but only 0.1% of the population decides to become immortal, is it fair to say that there was almost no innovation, since 99.9% of the population are unaffected? Obviously, the answer is no. And yet the economic statistics only captures adoption of innovation by the general population, not innovation itself, meaning that if the general population fails to take advantage of innovations the humanity develops, TFP and GDP will simply tell us that there was no innovation. This is exactly what’s happening with the internet.
What Bloom et al does show and is Romer right or is Jones right?
In 1990, Paul Romer published a paper Romer PM. Endogenous technological change. Journal of political Economy. 1990 Oct 1;98(5, Part 2):S71-102. which introduced the model of endogenous economic growth and for which he won the Nobel Prize in Economics. One of the implications of his model is that the exponential growth of the economy scales with the amount of research effort.
For example, suppose the economy is growing at 3% per year with a given amount of research effort in absolute terms. Endogenous growth theory predicts that this constant absolute amount of research effort be able to sustain 3% growth forever and that doubling research effort make the economy grow at 6% per year.
In the mid-1990s, Jones looked at the aggregate data and found that the endogenous growth theory is clearly wrong: the amount of research effort is increasing dramatically over time but TFP (interpreted as a measure of innovation) is growing at a roughly constant rate.
Therefore, Jones introduced his own model of semi-endogenous economic growth. Jones CI. R & D-based models of economic growth. Journal of political Economy. 1995 Aug 1;103(4):759-84. In this model, if research effort stays constant, growth eventually goes to zero and in order to sustain a constant exponential growth, research effort needs to be constantly increasing.
In response to Jones’s 1995 model, a bunch of people made new models that could accord the basic assumptions of endogenous growth theory with the aggregate evidence. In these models, the total number of products could be expanding quickly enough that, even though total research effort is growing, research effort per product is decreasing.
So what Bloom et al (Bloom, Jones, Van Reenen, and Webb) did kind of manage to do was to rebut those models. They looked at the individual case studies of “products” (transistors, crops, diseases) and found that research effort per product is increasing dramatically but the growth (exponential or linear) stays roughly the same.
Thus, Bloom et al concluded that Jones’ model is the right one after all and economists should be using it instead of Romer’s model.
Is this question interesting in the first place? Well, not really. It appears that economists kept using Romer’s model for the last 30 years because it provides clean assumptions and is easy to work with, Bloom et al: “The standard approach in recent years employs models that assume constant research productivity, in part because it is convenient and in part because the earlier literature has been interpreted as being inconclusive on the extent to which this is problematic. We believe the empirical work we have presented speaks clearly against this assumption.” and because there were these weird models that tried to explain away some of the wilder implications of Romer’s model, therefore allowing people to cite those papers and keep using Romer’s assumptions. Bloom et al: “An important justification for assuming constant research productivity is an observation first made in the late 1990s by a series of papers written in response to the aggregate evidence. These papers highlighted that composition effects could render the aggregate evidence misleading: perhaps research productivity at the micro level is actually stable. The rise in aggregate research could apply to an extensive margin, generating an increase in product variety, so that the number of researchers per variety, and thus micro-level research productivity and growth rates themselves, are constant. The aggregate evidence, then, may tell us nothing about research productivity at the micro level. Hence, the contribution of this paper: study the idea production function at the micro level to see directly what is happening to research productivity there.”
So, while Jones’ efforts at buttressing the idea that endogenous models of economic growth are wrong and people should stop using them even though they’re easy to work with are laudable, it doesn’t seem that anyone actually believes that doubling the economy’s research effort should double the rate of aggregate economic growth.
In fact, back in 2018, in an interview to Tyler Cowen, Romer himself said (a) that Jones is right:
If you go back to the really long-run questions that interested me, the big question was why, over the centuries, the millennia, has growth been speeding up? I had one model that I eventually concluded wasn’t exactly right. Then my second 1990 model — which I think, in terms of the foundations, was strong — but it had this feature that, as the number of, say, researchers or people grew, it predicted much too fast an acceleration in the rate of growth.
Chad Jones has really been leading the push, saying that to understand the broad sweep of history, you’ve got to have something which is offsetting the substantial increase in the number of people who are going into the R&D-type business or the discovery business. And that could take the form either of a short-run kind of adjustment cost effect, so that it’s hard to increase the rate of growth of ideas. Or it could be, the more things you’ve discovered, the harder it is to find other ones, the fishing-out effect.
To fit the long-run growth and the big increase in people engaged in science and in research and development, I think Chad is right that you have to have some kind of diminishing returns, or some kind of a constraint in that rate process. There’s a variety of recent papers that have tried to look at that.
Had Bloom et al focused strictly on the debate between Jones and the proponents of these weird variants of endogenous growth model, it would’ve been a lot stronger. However, it did not.
Instead of being called something like “Lol no endogenous growth models still don’t make any sense” and being interesting to 3.5 economists participating in the debate, the paper is called “Are Ideas Getting Harder to Find?”, is making sweeping statements unjustified by its data, and is being pushed to the general public, without making its context or the meaning of “ideas” it considers clear.
The question of how exactly research effort translates into ideas that translate into aggregate economic growth is just as mysterious as it was before Bloom et al: their case studies are uninformative and their aggregate data is neither novel nor informative.
We believe that it is unwise to build models of economic growth on the basis of their fit or lack of fit with TFP data and we believe that until we get better measures of innovation and better measures of economic growth, we are unlikely to make much progress trying to figure out how exactly economic growth arises.
Takeaways for economists
- We should be much less confident about the claims regarding ever increasing difficulty of finding new ideas and there’s much more low-hanging fruit to be picked trying to answer this question rigorously than we tend to appreciate.
- The question “are ideas getting harder to find?” can not be answered by looking at individual industries, because new industries could arise. You must look at aggregate innovation.
- The question “are ideas are getting harder to find?” depends critically on shape of the idea production function.
- e.g. suppose constant yearly input to research. If we model the idea production function as exponential but in reality it is linear, then it looks like research productivity is falling over time (“ideas are becoming harder to find”) but in reality they’re not.
- Bloom et al assume an exponential ideas production function because they appear to think that historical TFP growth has been exponential, which under their model would be implied by an exponential ideas production function.
- By defining what an idea is based on the historical pace of progress, one ensures that the research productivity estimates depend exclusively on the number of researchers: an increase in the number of researchers necessarily leads to the conclusion that the research productivity has decreased while a decrease in the number of researchers necessarily leads to the conclusion that the research productivity has increased.
- The US TFP has been growing linearly since at least 1950.
- TFP has been flat in Italy (1970-), Japan (1990-2009), France (2001-), and many other OECD countries, usually with big continued GDP per capita growth, meaning that non-innovation factors (e.g. misallocation, barriers to diffusion) do in fact dominate TFP change.
- You should not use TFP as a measure of innovation. Yes, you don’t have to follow this recommendation, since measuring innovation with TFP is still considered “standard”, you can always say that TFP “correlates” with innovation, and this will not prevent you from publishing in AER, but your paper is going to age about as well as all of those instrumental variable papers have aged. Brodeur A, Cook N, Heyes A. Methods matter: p-hacking and publication bias in causal analysis in economics. American Economic Review. 2020 Nov;110(11):3634-60. (a)
- Measuring the quality-adjusted number of researchers is hard:
- As the number of researchers goes up, we move up the supply curve, and quality goes down. Presumably, we could adjust for talent composition by dividing by wages. This would work if wages measured marginal productivity of labor but pay scales are compressed and so this would overstate the increase in inputs.
- We don’t know how substitutable the researchers are. Can 100 mediocre researchers do as well as 1 superstar researcher?
Conclusion
Bloom et al’s key conclusion stated in the abstract is: “everywhere we look we find that ideas, and the exponential growth they imply, are getting harder to find”.
However, consistent exponential growth Bloom et al study can only be found in one out of all of their case studies, and the design of the paper simply does not allow us to tell much about ideas or research productivity.
The case studies – if we believe the authors – are not relevant to the general question “are ideas getting harder to find?”, because new varieties are always being invented. Neither do the case studies convincingly show declining research productivity, due to the noisiness of the data and due to the fact that authors fail to follow any consistent way of defining an “idea”, essentially being able to get any result they want from the case studies.
The aggregate data is not convincing either, in light of the complete failure of TFP to track innovation. To claim – using TFP as a measure of innovation – that aggregate research productivity is declining is to claim that Italy, despite its real GDP per capita doubling, has not advanced technologically since 1970. There’s no way around this.
Thus, we believe that we are really massively undermeasuring innovation at the aggregate level, meaning that we cannot conclude on the basis of TFP that ideas are getting harder to find or that the research productivity is declining.
We all feel like the questions that can be asked easily – like “are ideas getting harder to find?” – ought to be able to be answered easily, yet following this logic, we find ourselves only lead further astray from the answers. And although we hope that science is self-correcting in the long-term, the existing structures of science seem to encourage falling in line, rather than trying to be right. For example, out of the 20 most recent papers that cite Bloom et al and out of the 20 most cited papers that cite Bloom et al, not a single one of them points out any flaws or contradictions in the paper.
Then, perhaps it is more difficult to do important research today, but perhaps the reason for that is the structural issues facing science, not the inherently rising difficulty of finding new ideas.
If this is the case, the solution is reform, rather than ever increasing amounts of money used to prop up the existing research structures, as recommended (a) by Bloom et al. And if we are to build better scientific institutions, then perhaps they ought not be designed by the captains of our old ones.
And if your views on science policy or on personal career choice were affected by Bloom et al telling the public that productivity of researchers has declined literally dozens of times over the last decades, you should at least revert them to whatever you believed before seeing the paper.
Acknowledgements
We would like to thank (in reverse alphabetic order) Misha Yagudin, Anatoly Vorobey, Janek Liscie, Paul Novosad, Alvaro de Menard, Stephen Malina, Jack Kendall, Holden Karnofsky, Basil Halperin, Tyler Cowen, Matt Clancy, Tamay Besiroglu, Leopold Aschenbrenner, and Scott Alexander for criticism and for invaluable feedback. All remaining errors are ours.
We would also like to thank Bloom et al for making all of their data and code freely available online.
Citation
In academic work, please cite this essay as:
Guzey Alexey, Rischel Eigil, Applied Divinity Studies, Anonymous, Anonymous. Issues with Bloom et al’s “Are Ideas Getting Harder to Find?” and why total factor productivity should never be used as a measure of innovation. Guzey.com. 2021 September. Available from https://guzey.com/economics/bloom/
Or download a BibTeX file here.
Data
Bloom et al’s Online Appendix (a) and Data Set
Our data as well as a copy of Bloom et al’s data (folder 111743-V2.zip) is available at this Dropbox link.
Changes to this essay can be tracked via this Github repository.
Appendix A: response from Nicholas Bloom, Charles I. Jones, John Van Reenen, and Michael Webb
Response from Nicholas Bloom, Charles I. Jones, John Van Reenen, and Michael Webb
September 8, 2021
- We are grateful for the thorough and thoughtful analysis that Alexey and his coauthors have undertaken. It’s great to have people beyond the academic economics community engage with our research. But overall, there is nothing here that argues forcefully against the main point of our paper: exponential growth in productivity is getting harder to achieve and sustaining exponential growth appears to require (at least) exponential growth in research effort. To put it more colloquially, do you really believe that the effective number of constant-quality researchers worldwide devoted to pushing Moore’s Law forward was the same in 1975 and 2005? That’s an example of what you’d have to believe for our finding to be incorrect.
- As we note clearly in the paper, there is no natural unit for ideas, so we focus on exponential economic growth, which ultimately underlies the exponential growth in living standards experienced in countries like the U.S. for more than a century.
- Our evidence strongly supports the hypothesis that exponential growth is getting harder to achieve, in the sense that growth rates are relatively stable or declining, while research effort is rising substantially.
- To the extent that growth is linear rather than exponential in certain industries or cases, this only reinforces the point that exponential growth is getting harder to achieve. If linear growth in productivity requires exponential growth in research, then certainly exponential growth is getting harder to achieve. The life expectancy case in the paper clearly and explicitly makes this point.
Appendix B: “Can a constant number of researchers generate constant exponential growth?” vs “Are ideas getting harder to find?”
To understand the difference between these two questions, suppose that we are studying wheat yield between 1970 and 2010. Crop yields is one of Bloom et al’s case studies but the numbers here are made up. All calculations are in Seed-data-v6-guzey.xlsx, Sheet “guzey”. Suppose that
- Yield in 1970 was 100 bushels/acre
- Yield in 1970 was growing at 3% per year
- Yield growth decreased by 0.025 percentage points per year, so that by 2010 yield was growing at 2% per year
- The number of wheat researchers between 1970 and 2010 stayed the same
First, let’s ask the question “can a constant number of researchers generate constant exponential growth?”. Had productivity of wheat researchers stayed constant, yield would have continued to grow at 3% per year. However, since growth declined to 2% per year, we have to conclude that research productivity has declined by 33% and that ideas are getting harder to find.
Second, let’s ask the question “are ideas getting harder to find?”. We do not have to believe that each idea simply increases yield by some fixed %. For example, perhaps, as yield grows, wheat starts to attract more and more pests, so that each new idea only manages to increase yield by some fixed number, whether yield is large or small. In 1970, yield was growing at 3 bushels per acre per year. But in 2010, it was growing at 5.4 bushels per acre per year. Since the number of researchers stayed the same but yield was growing 1.8 times quicker, we would conclude that research productivity increased by 80% and that ideas are getting easier to find.
Thus, if the question we are asking is “are ideas getting harder to find?”, determining the correct functional form of an idea is absolutely crucial, and to answer this question we need to study the shape of ideas in the given area of research.
At the same time, if the question we are asking is “can a constant number of researchers generate constant exponential growth?”, the functional form of an idea is irrelevant. The only things that matter are the number of researchers and the rate of growth.
Appendix C: Bloom et al’s estimates of the number of researchers fail to adjust for changes in talent
What if in the 1970s, the semiconductor industry was employing many of the geniuses who today would’ve been working in software engineering or machine learning?
Today, the biggest employer of Harvard and MIT alumni is Google, by a wide margin. According to LinkedIn, 3002 Harvard and MIT alumni work at Google. Google and Intel have roughly the same number of engineers, according to LinkedIn: 74k vs 61k The next biggest employers are Microsoft and Amazon, with 1,446 and 1,323 people, respectively.
If the semiconductor industry did indeed experience talent depletion, then it might have 18 times more R&D spending and researchers today than in the 1970s but it would be completely unreasonable to expect those researchers to produce 18 times more ideas.
Bloom et al take this concern seriously and note that the “effective scientists” number already incorporates potential changes in the talent level of researchers:
our measurement of research effort already incorporates a market-based adjustment for the depletion of talent: R&D spending weights workers according to their wage, and less talented researchers will naturally earn a lower salary. If more of these workers are hired over time, R&D spending will not rise by as much
That is, Bloom et al assume that $1 in R&D is $1 in R&D, and constitutes the same amount of effective researchers, regardless of the quality of individual researchers. Even if it is true that the most talented researchers have left for other industries, the industry in question will simply hire some larger number of less talented researchers, who will then produce the same number of ideas and cost the semiconductor industry the same amount of money as the original researchers did.
Note here that Bloom et al never provide any evidence that their talent correction actually reflects how talent is compensated.
And, conceptually, their reasoning sounds pretty reasonable… except this is not what we observe happening. Researcher productivity is incredibly unequally distributed [1 (a), 2 (a)], but researcher pay is relatively homogeneous.
Steve Wozniak says: Livingston J. Founders at work: Stories of startups’ early days. Apress; 2008 Nov 1.
Even back in high school I knew I could design computers with half as many chips as the companies were selling them with.
How much more talented was Wozniak, compared to an ordinary engineer? 100x? 1000x? How much was he paid? According to Bloom et al’s salary data, the average salary of all males with a four year degree in 1976 was $20,516 per year. Supplementary files to Bloom et al, WageSci/WageEducation.m, line 51. In 1976, Wozniak’s salary as an engineer at HP was just $25,000 a year – just 1.22x. Livingston 2008: “When Steve called me one day at work and he said he got an order for $50,000—100 built computer boards for $500 each—that was high money. That was twice my annual salary at Hewlett-Packard.”
How much were the three inventors of the transistor – Bardeen, Shockley, and Brattain – making (100x the impact of an ordinary researcher? 1,000x? 10,000x?)? We couldn’t find the data for Brattain, but Bardeen (a) got offered $10,000 a year in 1951, after building the first transistor. This is only about 2x of the average salary of all males with a four year degree in 1951. Supplementary files to Bloom et al, WageSci/WageEducation.m, lines 34-35.
What about Shockley? In 1956, he started Shockley Semiconductor Laboratory and set his own salary to be an enormous $30,000 per year… which is less than 4x the salary of Bloom et al’s “high-skilled worker” in 1956. Supplementary files to Bloom et al, WageSci/WageEducation.m, line 35. In fact, thanks to Shockley mandating all salary data to be public, we know exactly how much every researcher at Shockley Semiconductor Laboratory was making in 1956. The lowest paid researcher was making $6,000 per year and the highest paid researcher (Shockley) was making $30,000 per year – just 5x difference. Lojek B. History of semiconductor engineering. New York: Springer; 2007 Apr. Page 74.
It is clear that the researcher salary is not at all proportional with talent level and that Bloom et al’s correction fails to adjust for differences in talent between researchers.
Suppose that just 10 genius researchers in the world are coming up with all of Moore’s Law ideas. Then, one day Google comes along, offers them a higher salary, and turns them into software engineers. Next year the semiconductor industry hires 1000 ordinary researchers to compensate for those 10 geniuses, pays each of those ordinary researchers 20% of the genius salary, and ends up spending (1000/10)*0.2=20x more on salaries in aggregate. Bloom et al would then conclude that 20 times more researchers are required to double chip density this year than in the last year.
While we do not have solid data on the changes in the talent level of semiconductor researchers between 1971 and 2014, if they were significant, Bloom et al greatly overestimate the increase in the effective number of researchers required to achieve doubling of chip density.
We believe that this is indeed likely the case. In every era, some fields attract more geniuses than others. In mid-20th century, electrical engineering was such a field. Just Bell Labs once housed Shockley, Brattain, Bardeen, Boyle, Houser Kahng, Amelio, Atalla, Conwell, and other brilliant researchers working on semiconductors. Four out of eight (a) founders of Fairchild Semiconductor (founded in 1957) were MIT Alumni. But today, the software industry – inchoate in the 1970s – is dominating the competition for talent.
Google’s employees most often come from Stanford and Intel’s employees most often come from Arizona State University.
According to levels.fyi, the starting salary of a software engineer at Google, Microsoft, and Amazon is $187k (a), $160k (a), and $161k (a), respectively. In contrast, the starting salary of a software engineer at Intel is $102k (a) and of a hardware engineer is $114k.
Intel is simply not competing with Google, Microsoft, and Amazon for the same talent.
As an aside – can geniuses be substituted by less talented researchers at all? Joel Spolsky notes (a) that “Five Antonio Salieris won’t produce Mozart’s Requiem. Ever. Not if they work for 100 years.”
Should we expect that one genius researcher can be substituted by some larger number of ordinary researchers? Would many ordinary physicists produce the string theory? Would many ordinary mathematicians prove the Fermat’s Last Theorem? Would many ordinary electrical engineers invent a transistor? Bloom et al assume that the answer to all of these questions is yes, although they never explain why they believe this to be the case.
Appendix D: the connection between the measured research input and the increase in the measured variable in Bloom et al’s case studies is dubious
If you want to claim that the researcher community X has become less effective by comparing them to the growth of Y, you have to establish a strong causal link: you have to show that the growth of Y is unlikely to change as a result of something other than the researchers in question becoming more or less effective.
Bloom et al have also thought about this problem. They write:
Our selection of cases is driven primarily by the requirement that we are able to obtain data on both the “idea output” and the corresponding “research input.” […] For example, we also considered the internal combustion engine, the speed of air travel, the efficiency of solar panels, the Nordhaus (1997) “price of light” evidence, and the sequencing of the human genome. […] But it turns out that Moore’s Law is itself an important contributor to the fall in the price of gene sequencing. How should we combine these research inputs?
We find the last point dubious: surely the proliferation and cheapening of computers has affected all sorts of domains, not just gene sequencing. Surely a modern semiconductor fabrication facility couldn’t exist without computers - how can we account for this self-reinforcing effect of Moore’s law? It seems that similar problems are likely to occur in every field and it is therefore unclear why Bloom et al excluded gene sequencing due Moore’s Law being an important contributor to its progress, yet included Moore’s Law case study itself.
Below, we explain why the causal relationships assumed by Bloom et al in the other two case studies – medical research and agriculture research – are also questionable.
For some diseases, Bloom et al weigh the effectiveness of medical research by their incidence, meaning that the more people get the disease, the more effective the researchers become.
Bloom et al’s figure for the output of medical research in a given disease is the number of life-years saved per 1000 people by reductions in the death rate of that disease. This is per 1000 people in the whole population, meaning that if more people get cancer, but death rates for cancer patients continue to improve at the same rate, Bloom et al measure an increase in the effectiveness of cancer researchers.
One could argue that this is a reasonable way of estimating the cost-effectiveness of medical research – after all, if a disease is less prevalent (or, more precisely, accounts for a lower share of all deaths), then reducing its deadliness is less important. But this seems to have little to do with medical research itself. It would be like saying that the researchers pushing Moore’s law forward have become more effective because computers have become more prevalent – this has increased their economic relevance, for sure, but there’s no reason it should affect how quickly they can bring transistor density down (except by motivating more funding, which already is captured by the research inputs measure).
What makes this worse is that Bloom et al are actually inconsistent about how they estimate death rates:
- For heart disease, they simply use the overall death rate as the estimated death rate
- For cancer, they estimate the death rate conditional on getting cancer by the five-year survival rate
This means that, in the case of heart disease, researchers are getting credit for drops in incidence. If 10% less people get heart diseases, but those that get it die at the same rate, the heart disease researchers are credited with saving however many years of life this change actually saved (as mentioned, this depends on how old people are when they die of heart disease, how many people get heart diseases in the first place, and so on). On the other hand, if 10% less people get cancer, but those that get it die at the same rate, the cancer researchers get no credit, their productivity is zero.
In a comment in Bloom et al’s code, they mention that the overall death rate for cancer actually went up between 1975 and the early 1990s (because incidence increased in this period), so they changed it to conditional death rates to get nicer results. On the other hand, doing conditional death rates for heart disease would take away most of the reduction, so there they stuck with the overall death rate. Mortality/mortality.m:
For Breast Cancer, I initially used the U.S. mortality rate data. I was surprised that the death rate from breast cancer rose between 1975 and the early 1990s. It turns out the same thing is true for All Cancer mortality as well. My interpretation of this is that mortality from other causes fell enough that now people are living long enough to actually get cancer, whereas before they were not. So # of deaths could rise even though the mortality rate conditional on getting cancer could fall. Now I’m using 5-year survival rates to measure “Probabilit of Death conditional on getting Cancer” and using that as the death rate to plug into our calculation. Should be better, I think… For HeartDisease, we do not want to condition on getting the illness, since a lot of the decline comes from reductions in this. So pass [] for FiveYearSurvRate and do not use it.
It’s not an a priori the wrong thing to do, but doing one thing for cancer and another for heart disease seems very inconsistent and from Bloom et al’s own comments, it appears this change was really entirely motivated by the fact that this combination made the results come out nicely.
Agricultural productivity is held back by evolving resistance, meaning that the researchers can be arbitrarily effective while yields stay constant or even decrease
Bloom et al measure ideas in agricultural research by looking at yields - how much crop do you get per acre of field? Like everything else in the paper, this rests on the assumption that this yield depends primarily on the ideas generated by agricultural research. We will argue here that there is another critically important factor: yields gradually decline because of herbicide and pesticide resistance. Weeds and pests develop resistance, which means that if the agricultural community completely stopped developing new ideas, yields wouldn’t just hold stable at their current levels, but would actually regress. Bloom et al do not discuss this issue.
We can draw an analogy to the well-known situation in medicine, where antibiotics-resistant bacteria are rapidly adapting to each new antibiotic. In fact, in medicine, they’re mostly outpacing our efforts to invent new antibiotics, see e.g. Ventola 2015 Ventola CL. The antibiotic resistance crisis: part 1: causes and threats. Pharmacy and therapeutics. 2015 Apr;40(4):277.
It’s hard to compare the two fields side-by-side and say whether the situation in agriculture is “worse” or “better” than in medicine. But it’s definitely clear Shaner DL. Lessons learned from the history of herbicide resistance. Weed Science. 2014 Apr;62(2):427-31. that herbicide and pesticide resistance are serious issues.
Suppose that
- Each new type of herbicide can be used for ten years before crops develop resistance to it and you have to start using a new one (This isn’t really how it works, and that number was made up)
- The research community develops a new herbicide every ten years, i.e. the research productivity is constant
This however won’t lead to a constant growth in the output, because the researchers are just keeping up with nature. In reality, of course, it’s much more complicated. There are things farmers can do to slow the spread of resistance down. Standard practice is to spray with multiple different “methods of action” (meaning “ways of killing the weed” – these are roughly the things that weeds develop resistance to), so that any plant with some resistance to one of the herbicides will be killed by the other one. That way you don’t select very strongly for resistance (because even the resistant ones die). So the rate of resistance development is not just a function of the properties of the herbicide, but can be changed by doing things smartly (or worsened by doing things stupidly – in the early days of glyphosate, people were apparently overconfident about weeds developing glyphosate resistance, and just doused their fields in the stuff. Now glyphosate resistance is a serious issue).
We can tell the following story about agricultural research: back in the 60s and 70s, we got a lot of improvements by inventing better herbicides and improving crop varieties. Eventually, weeds started catching up, and we had to sink a lot of effort into just staying at parity. Of course, there were great advances in both the quality of seeds and in crop protection, but a lot of the gains were eaten up by old herbicides becoming less useful, and a lot of effort went into just inventing new herbicides, not because they would be more effective or easier to use, but just because they would be new and therefore weeds wouldn’t have resistance to them.
In this story, it’s entirely plausible that even though there were more researchers, and they were producing more research output, the gains in yield wouldn’t become proportionally higher.
Note that the fact that crop protection has become a relatively smaller part of the research expenditure compared to seed improvement doesn’t really change this picture, because the gains from improved seeds could be getting cancelled out by the fact that weeds are becoming more of a problem.
Appendix E: the US regressed technologically between 1973 and 1982
Below is Bloom et al’s model of economic growth for the US and OECD countries. Bloom et al use aggregate OECD R&D data as one of their robustness checks. Note that by “economic growth” Bloom et al mean “Total Factor Productivity growth”:
$$ \underset{\text{per year}}{\text{Growth}} = \underset{\text{per year}}{\text{Ideas produced}} = \text{Research productivity} \times \text{Research effort} $$
Based on this model, we can compare the 1930s research productivity and the 2000s research productivity:
$$ \text{1930s TFP growth} = \text{1930s research productivity} \times \text{1930s number of researchers} $$
$$ \text{2000s TFP growth} = \text{2000s research productivity} \times \text{2000s number of researchers} $$
$$ \text{1930s research productivity} = \frac{\text{1930s TFP growth}}{\text{1930s number of researchers}} $$
$$ \text{2000s research productivity} = \frac{\text{2000s TFP growth}}{\text{2000s number of researchers}} $$
$$ \frac{\text{1930s research productivity}}{\text{2000s research productivity}} = \frac{\text{1930s TFP growth}}{\text{2000s TFP growth}} \times \frac{\text{2000s number of researchers}}{\text{1930s number of researchers}} $$
Bloom et al calculate that
- The “effective number of researchers” in the US has increased by 23 times between the 1930s and the 2000s Supplementary files to Bloom et al, Aggregate/AggregateBLSIPP_Main.log, line 238, column “Scientists”.
- 1930s TFP growth was 1.82% per year Supplementary files to Bloom et al, Aggregate/AggregateBLSIPP_Main.log, line 231, column “TFPGrowth”.
- 2000s TFP growth was 1.01% per year. Supplementary files to Bloom et al, Aggregate/AggregateBLSIPP_Main.log, line 238, column “TFPGrowth”. Note here that “2000s” are years 2000-2014
Normalizing the number of scientists to be equal to 1 in the 1930s and plugging in the numbers:
$$ \frac{\text{1930s research productivity}}{\text{2000s research productivity}} = \frac{1.82}{1.01} \times \frac{23}{1} \approx 41 $$
Accordingly, Bloom et al write:
We find that research productivity for the aggregate US economy has declined by a factor of 41 since the 1930s, an average decrease of more than 5 percent per year.
Now, since Bloom et al consider the years 2000-2014 in their key aggregate US economy result, we know that we can move the years around a bit rather than stick strictly to decades in the format of xxx0-xxx9.
With this in mind, let’s find how much research productivity changed between the 1930s and the decade of 1973-1982. Repeating the calculation above:
$$ \frac{\text{1930s research productivity}}{\text{1973-1982 research productivity}} = \frac{\text{1930s TFP growth}}{\text{1973-1982 TFP growth}} \times \frac{\text{1973-1982 number of researchers}}{\text{1930s number of researchers}} $$
Now, the growth rate of TFP between 1973 and 1982 was -0.2% per year 1973 TFP was 75.36 (Supplementary files to Bloom et al, Aggregate/AggregateBLSIPP_Main.log, line 62, column “TFPIndex”), 1982 TFP was 73.89 (Supplementary files to Bloom et al, Aggregate/AggregateBLSIPP_Main.log, line 71, column “TFPIndex”). 75.36*(0.99803^10)=73.89. and there were 2.7 times more scientists in the decade of 1973-1982, compared to 1930s. Take the geometric average of the number of scientists in 1973-1982 from supplementary files to Bloom et al, Aggregate/AggregateBLSIPP_Main.log, lines 183-192, column “ScientistsIpp” and divide by the geometric average of the number of scientists in 1930-1939 from lines 140-149. Get 8364922/3052235=2.7. Plugging in the numbers:
$$ \frac{\text{1930s research productivity}}{\text{1973-1982 research productivity}} = \frac{1.82}{-0.2} \times \frac{2.7}{1} \approx -25 $$
Wait, research productivity in the 1930s was -25 times higher (lower?) than in 1973-1982? What does this even mean?
Negative research productivity simply means that, instead of progressing, technology has been regressing. This is the direct interpretation of Bloom et al’s data, using Bloom et al’s model.
Although Bloom et al partly concede that there are factors other than research that affect TFP growth, writing:
One might question the TFP growth numbers: how much of TFP growth is due to innovation versus reallocation or declines in misallocation? One might seek to include international research in the input measure.
They ultimately dismiss these factors:
reasonable variations along these lines would not change the basic point: a model in which economic growth [TFP] arises from the discovery of newer and better varieties with limited possibilities for productivity growth within each variety exhibits sharply-declining research productivity.
As we have shown previously, the assumptions Bloom et al make about technology and TFP here do not hold up to scrutiny.
Appendix F: a letter from an employee of two of Bloom et al’s semiconductor firms
The silicon chip industry isn’t what people think it is. The view presented in the media is distorted. It progresses like a branching tree, not like a straight line. When discussing it people from outside the industry concentrate on Microprocessors and on Moore’s law. That’s important certainly and the microprocessor firms like Intel and AMD are very big. But it’s not all there is to it. That’s one of the main problems with what Bloom et al claim. They count researchers from many companies but most of those companies have nothing to do with Moore’s law.
I have worked for two of the larger semiconductor companies mentioned in the Bloom paper. There are many type of chip out there, the applications for silicon are increasing all the time. Most of the work in these companies is the design of new products and processes to make them. But, lots of that has nothing to do with Moore’s law. Moore’s law is strongly connected to density. In turn density has a large effect on logic speed. But, density and logic speed aren’t always important.
Take sensors for example, 30 years ago few of those were silicon. Today you can buy silicon chips that measure temperature and report it digitally. You can get not just light sensors but also the image sensor arrays used in digital cameras and mobile phones. Those have more-or-less replaced chemical photography. Acceleration can be measured and that’s used in things like airbag sensors in cars. Even smartphones have accelerometers in them. Gas sensing is also possible, though it’s a niche area at present. None of this has much to do with Moore’s law issues like transistor density.
The same applies to many other areas. There are analog components like amplifiers and oscillators. Those are still being developed and used in nearly every consumer device. There are analog-to-digital converters and digital-to-analog converters, those are used whenever sound or sensors are involved. Then there’s frequency generators (PLLs) and power detectors. Those are needed whenever radio is involved, in WiFi or 5G, for example. There’s Flash RAM (used in solid-state drives), which has displaced rotary hard-drives in consumer PCs and most servers. Then, there are many many different types of power supply chip to feed power to everything else.
The processes used to make all those things are different to those used to make microprocessors. The processes that are on the cutting-edge of transistor density and speed are not necessarily useful for other things. Lots of development is going on to make processes that do the other things, that’s what lots of engineers are doing.
You may have heard of GPUs and FPGAs. Those sometimes use the same processes as microprocessors, but they’re the last holdouts. Now, the makers of computer memory (DRAM) have their own processes. Flash memory processes are also different. For image sensor arrays it’s the same story. Power supplies have yet another set of processes designed for higher voltages and currents. Radio frequency chips often don’t even use Silicon, they use other semiconductors like Gallium Arsenide or Gallium Nitride. Lots of those processes have very poor density, and development of them plays no role in helping density improve.
Moore’s law type issues like density and number-of-transistors are pushed forward by a relatively small group of companies. There’s ASML, a Dutch company that is the main lithography equipment vendor in that field. Then there are the microprocessor companies (e.g. Intel), some GPU companies and their fabrication partners like TSMC. Those are big companies, but they’re still only a fraction of the whole industry.
Bloom et al count all research cost across a huge swath of the industry. Most of that has nothing to do with driving Moore’s law.
Here’s an example of this phenomenon that we found in Bloom et al’s data:
Bloom et al estimate that in 2014, Qualcomm, Broadcom, and Nvidia – all among top 5 biggest contributors among semiconductor firms in the data set – had 102k researchers required for Moore’s Law. Supplementary files to Bloom et al, MooresLaw/MooresLawRND-2018-01-08.xls, Sheet “PatentBroad”, (L54+M54+N54)/90276. All those firms are “fabless”, meaning that they design chips but contract out the manufacturing of those chips to companies like TSMC and Samsung while doing little manufacturing research themselves and it’s not clear how they contributed to Moore’s Law.
References
Bloom N, Jones CI, Van Reenen J, Webb M. Are ideas getting harder to find?. American Economic Review. 2020 Apr;110(4):1104-44.
Brodeur A, Cook N, Heyes A. Methods matter: p-hacking and publication bias in causal analysis in economics. American Economic Review. 2020 Nov;110(11):3634-60.
Romer PM. Endogenous technological change. Journal of political Economy. 1990 Oct 1;98(5, Part 2):S71-102.
Jones CI. R & D-based models of economic growth. Journal of political Economy. 1995 Aug 1;103(4):759-84.
Berlin L. Troublemakers: Silicon Valley’s Coming of Age. Simon and Schuster; 2017 Nov 7.
Livingston J. Founders at work: Stories of startups’ early days. Apress; 2008 Nov 1.
Lojek B. History of semiconductor engineering. New York: Springer; 2007 Apr.
Jones CI. The facts of economic growth. In Handbook of macroeconomics 2016 Jan 1 (Vol. 2, pp. 3-69). Elsevier.
Brynjolfsson E, Collis A, Eggers F. Using massive online choice experiments to measure changes in well-being. Proceedings of the National Academy of Sciences. 2019 Apr 9;116(15):7250-5.
Rachel Ł. Leisure-Enhancing Technological Change. Unpublished paper. 2020 Dec 13.
Ventola CL. The antibiotic resistance crisis: part 1: causes and threats. Pharmacy and therapeutics. 2015 Apr;40(4):277.
Shaner DL. Lessons learned from the history of herbicide resistance. Weed Science. 2014 Apr;62(2):427-31.
Further reading
Ricón, José Luis, “No Great Technological Stagnation”, Nintil (2016-04-25), available at https://nintil.com/1-no-great-technological-stagnation/ (a).
Vollrath, Dietrich. Slumping productivity: We’re victims of our own success (a).
Crawford, Jason. Teasing apart the S-curves (a).
Reinhardt, Benjamin. Notes on Are Ideas Getting Harder to Find? (a).
Ricón, José Luis, “Are ideas getting harder to find?”, Nintil (2020-11-23), available at https://nintil.com/ideas-harder-find/ (a).
de Menard, Alvaro. What’s Wrong with Social Science and How to Fix It: Reflections After Reading 2578 Papers (a).
Deeply Credentialed Yuga. One thing I’ve never really gotten over about industry is just how much of the economy is about unfucking other parts of the economy. Twitter. 2020 Nov 17. Available at https://twitter.com/MelancholyYuga/status/1328574530739195904 (a)