An Ad Hominem Argument Against GDP
created: ; modified:Epistemic status: this is not the argument against GDP but it’s definitely underappreciated.
Suppose, you read about some study in the media and decide to check the study’s findings yourself. What do you do?
First, you can read the abstract of the paper and look at some summary statistics that the researchers provided. Most likely, you will realize that this is just another bullshit correlational study or that n is equal to like 10; sometimes, you will see that the effect is too large to be believable; occasionally, you will find that the summary statistics are actually impossible. You will definitely miss the dinosaur. Source.
Second, you can inspect the data itself. This way you can notice that, for example, the data looks kind of weird or, conversely, too normal; or you can notice that the researchers forgot to select some rows in Excel when analysing the data or let Excel interpret genes’ names as dates.
Third, you can think about how the study’s data is defined, collected, and analyzed. Thus, you will understand how it’s possible that the US is the 10th most dangerous country in the world for women or that Sweden has the highest rape rate in the world; or you may come to understand how some fMRI analyses may feature up to 70% false positive rate; or how, for that matter, the entire quantitative scientific literatures can be complete bullshit. Likely, a consequence of treating statistics as a significance-producing machine.
Fourth, — this is where we start to ignore the data and move meta — you can look at the incentives people face when producing the data. Think about it for a while and you won’t be surprised to learn that countries routinely embellish their GDP data, PISA scores, and likely any other statistic of any consequence. When I interned at the Russian Government we analyzed the data on performance of some bureaucrats. I asked my boss if this data was used to promote those who do well, to which the answer was, “if we started using the data, everybody would just doctor it.”
Finally, you can look at the actual people who produce the data. Specific people collect, systemize, analyze and only then show it to us; and — even having incentives taken into account — it matters who these people are.
GDP estimation
I have precisely one idea: estimating GDP (and comparing estimates over time) is an incredibly complex process and it matters who creates these estimates.
So, let me ask you a question: who would you trust with producing US GDP estimates and the methodology for estimating GDP?
And after you have a personal answer to this question, let’s see
Who exactly creates GDP estimates
In the US — Bureau of Economic Analysis (BEA). Besides various national, regional, international, and industry accounts, BEA produces the methodology for GDP estimation and the estimates themselves.
But before looking more closely at BEA, let’s take a slight detour to academia.
I looked at all professors of Economics, excluding visiting and emeritus professors, at several US universities. For every professor, I looked at the university they got their PhD from and at the RePeC rank I used the June 2018 ranking. of that university. RePeC stands for “Research Papers in Economics” and their rankings are considered to be somewhat canonical. Note that only top 280 universities are ranked, so if the university is not in top 280, I wrote down its rank as 280.
Below are histograms for Harvard (rank 1), University of Southern California (rank 25), University of Minnesota (rank 61), and University of Pittsburgh (rank 89). Initially, I wanted to pick ranks 1, 25, 50, 75, but universities at ranks 50-60 are not American, so I picked rank 61. Then, ranks 86, 87 are again not American, rank 88 (CMU Tepper) shows large discrepancy in the number of faculty listed on RePeC and on CMU’s site, so on a semi-ad hoc basis I decided to look at rank 89.
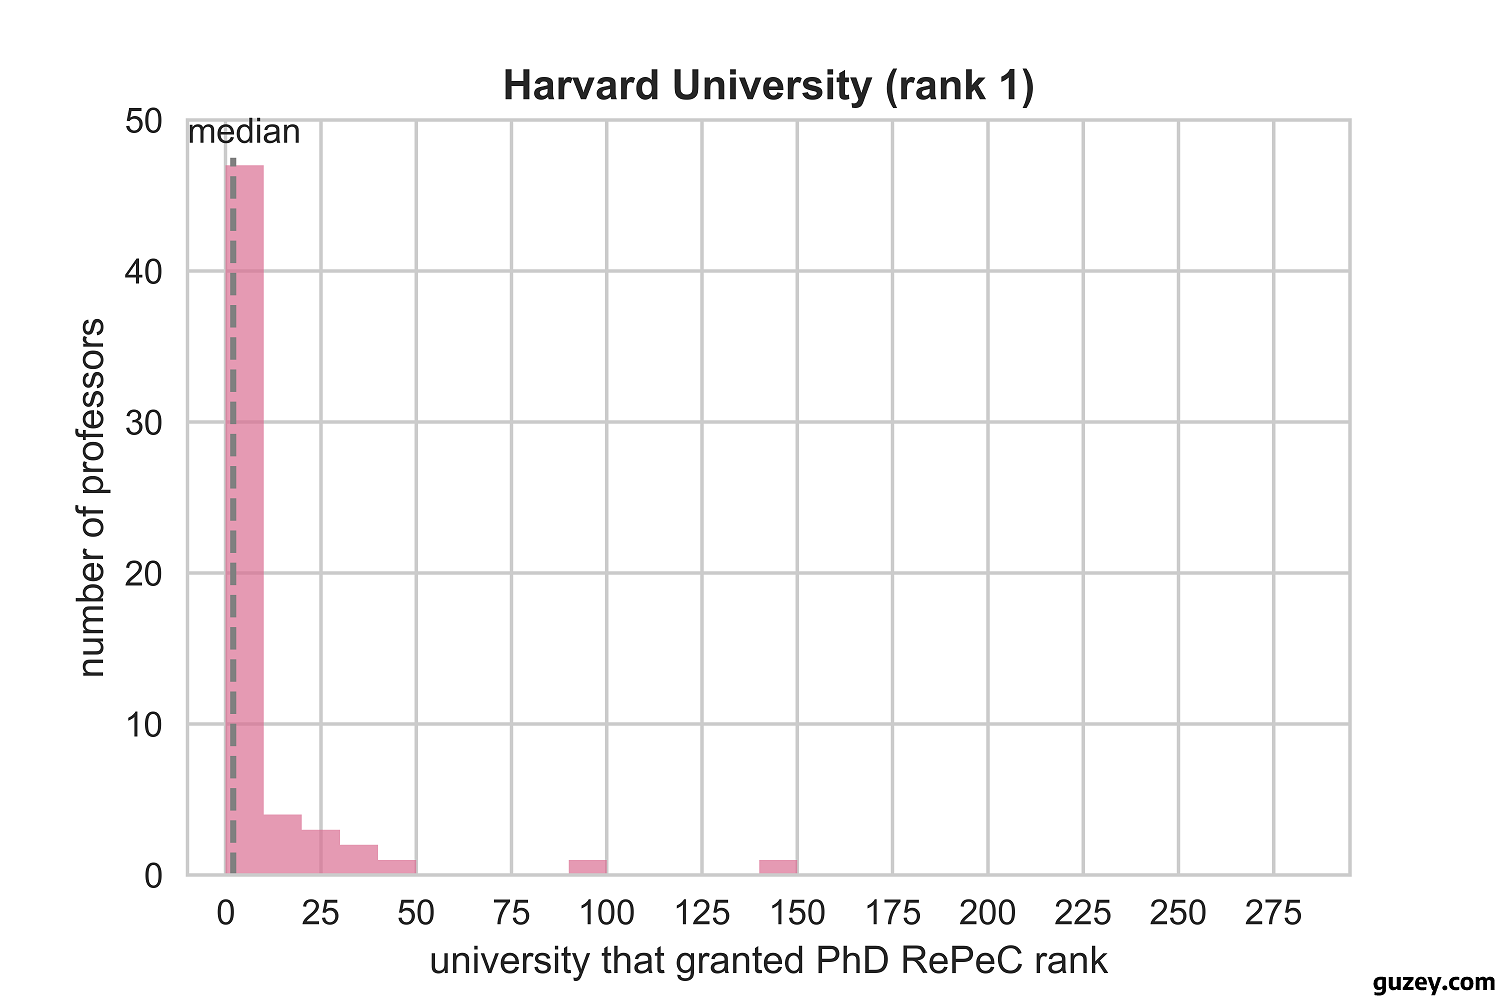
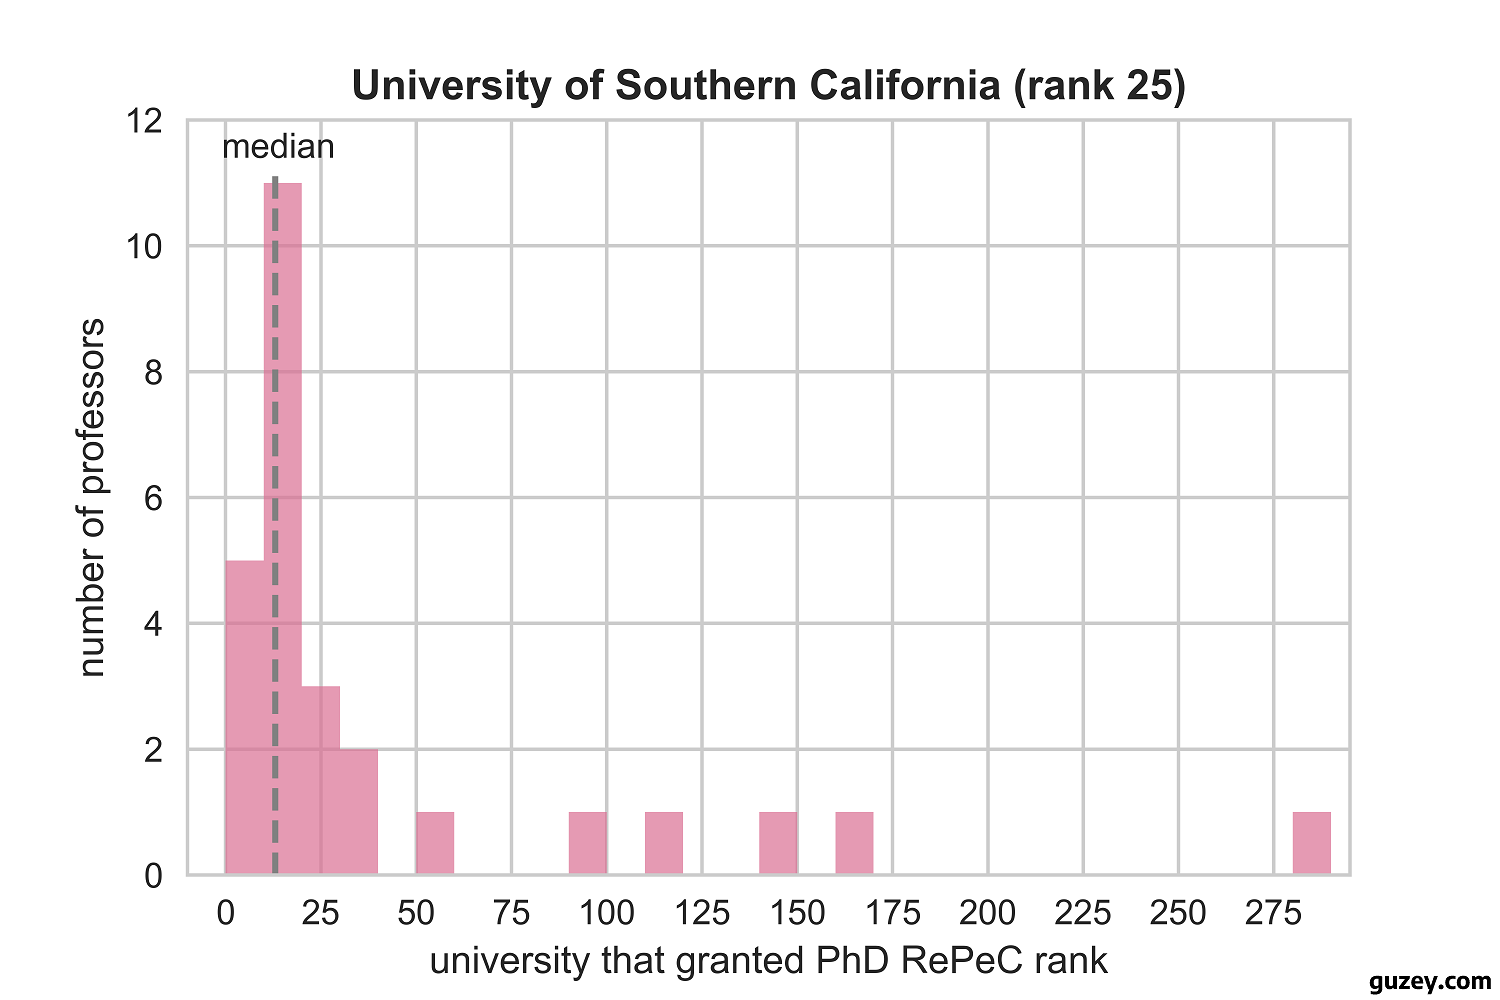
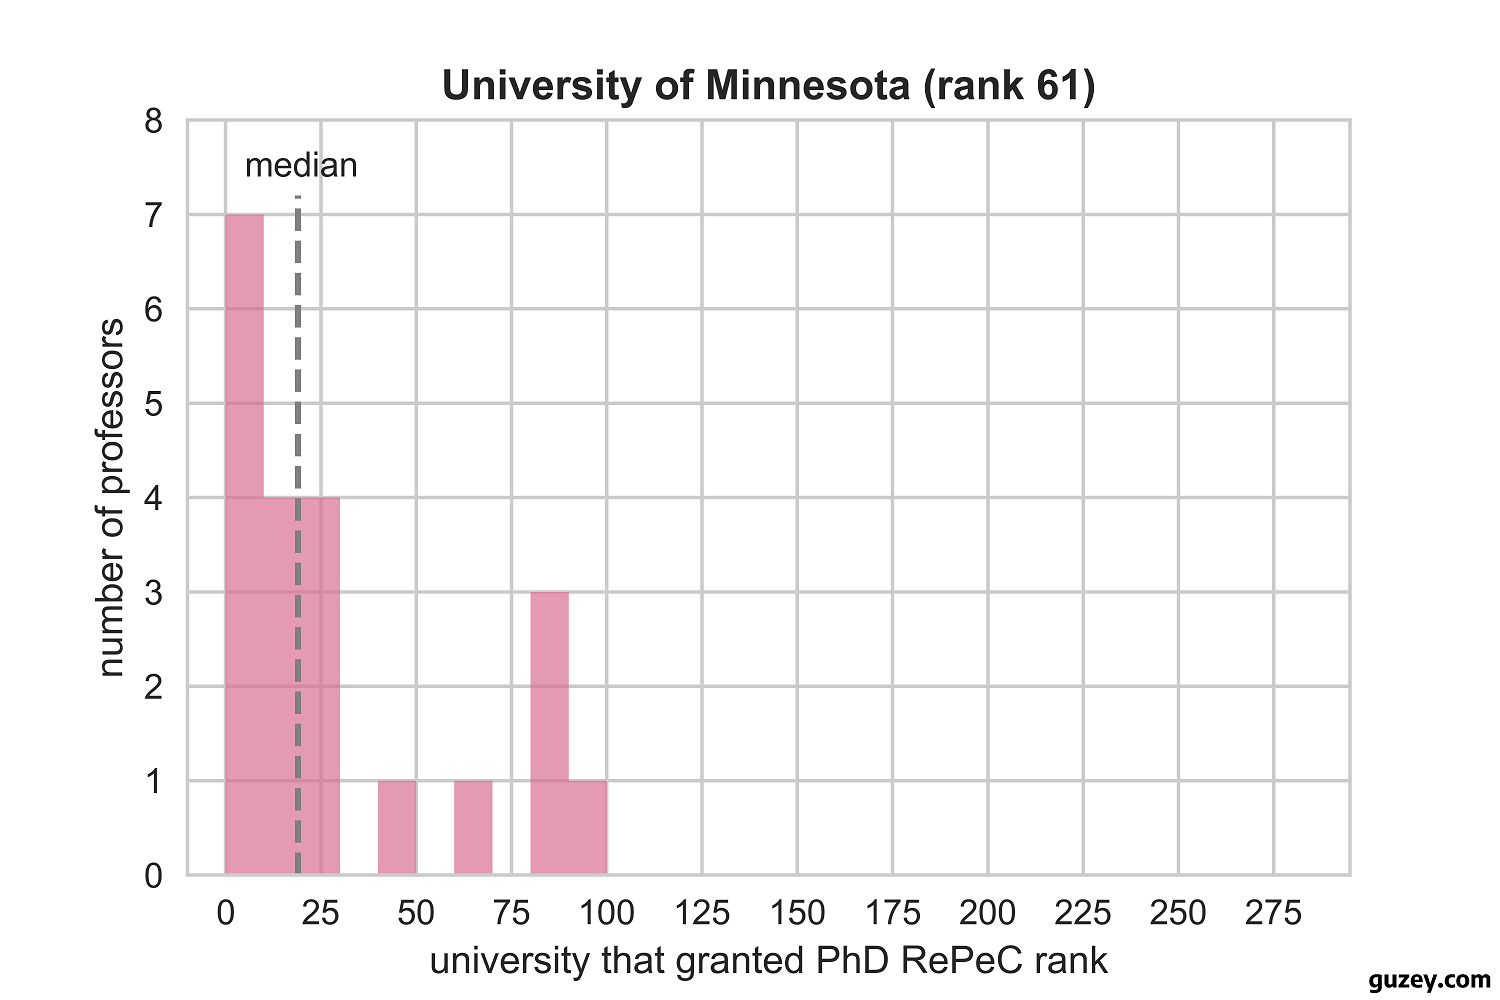
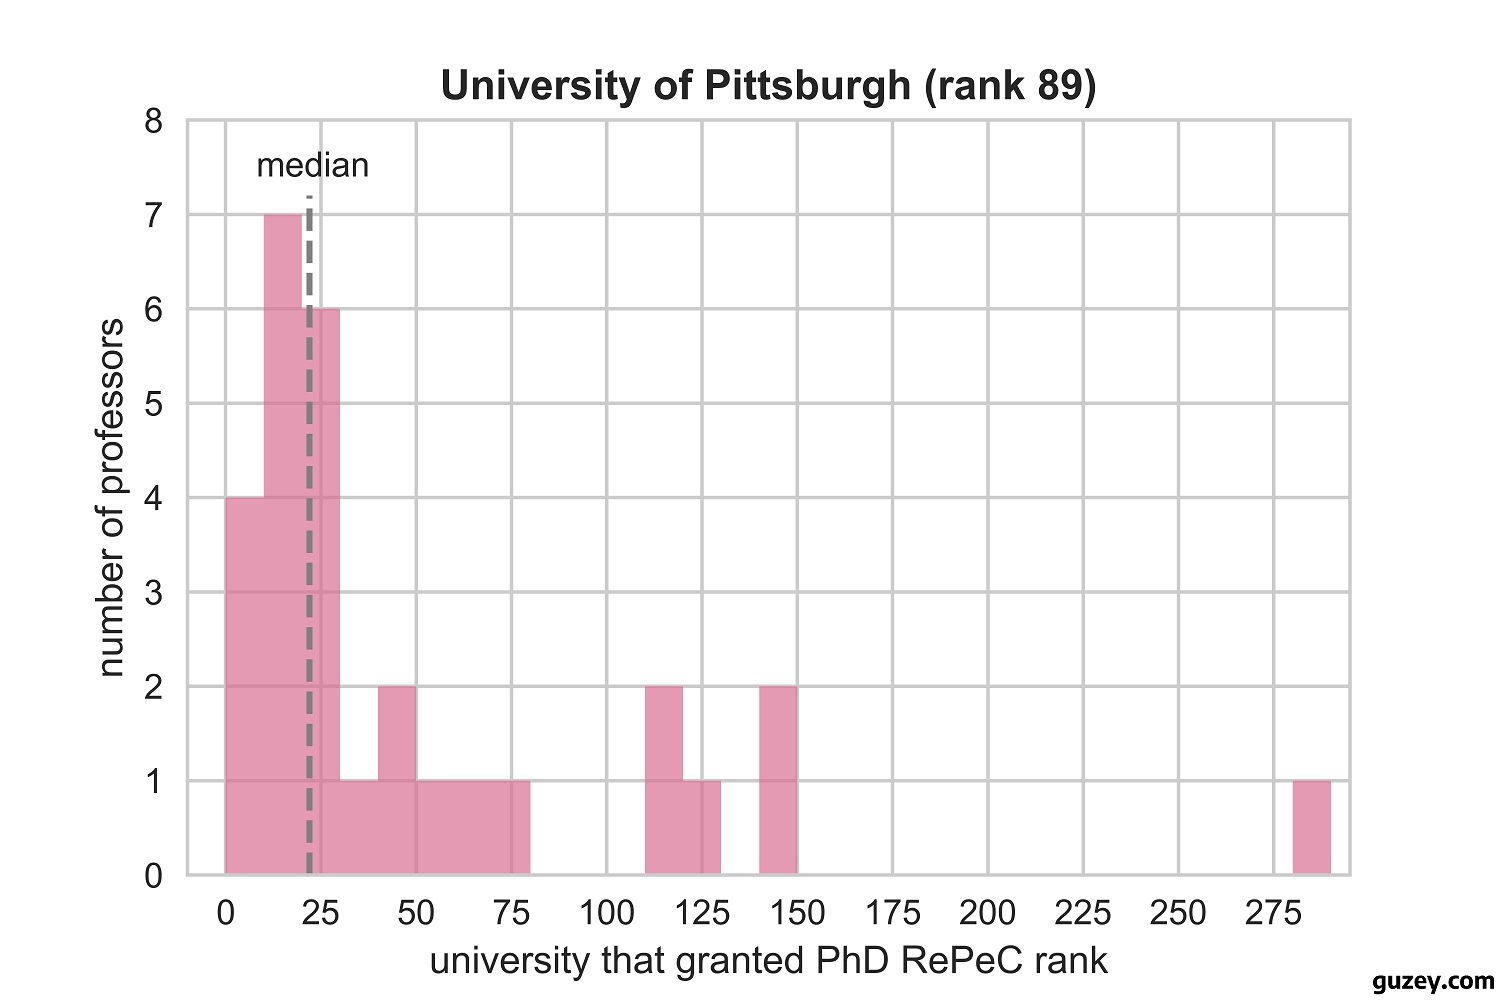
We can see a clear, if somewhat weak, trend from the pictures — among Harvard professors more than 50% got their PhD either from Harvard or MIT (rank 2). Then, the median steadily declines to 13 (Yale), 19 (Michigan), and 22 (Northwestern).
What if we build a similar histogram for the Federal Reserve Bank of New York?
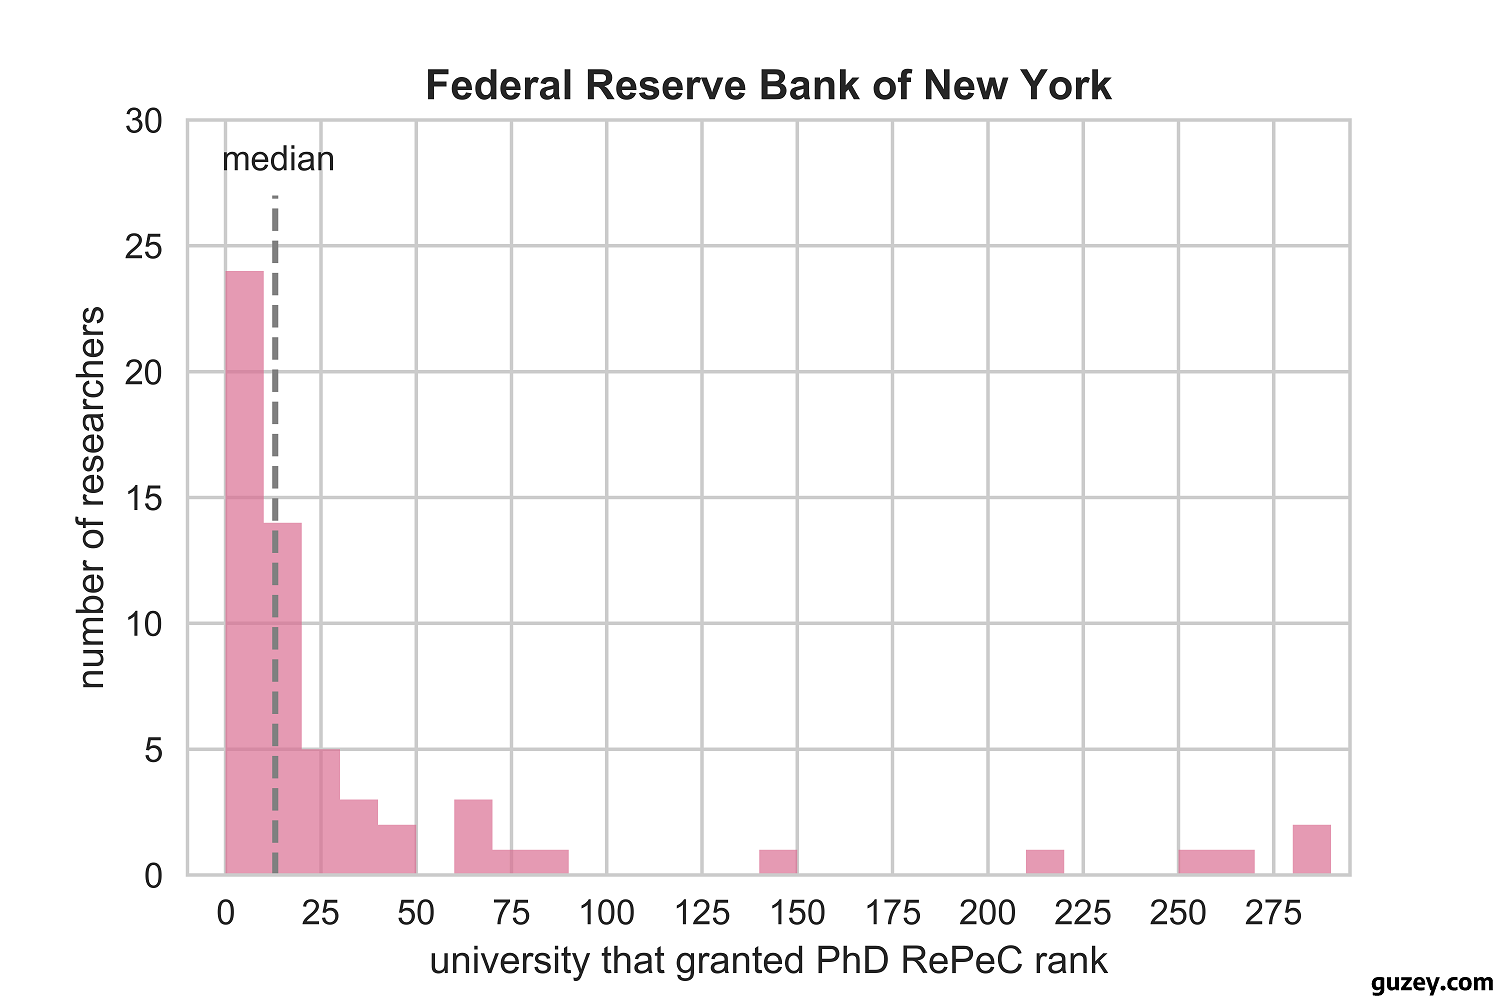
The data suggests that if New York Fed was an Economics Department, it would be solid — not the best — but a solid department. The median researcher there got their PhD from Yale.
BEA’s site lists 44 people in the Research at BEA section. Listed, to be precise. The page was removed after the BEA’s site redesign in mid-August 2018. Looking at the profiles, we can see that BEA hires quite a few Economics PhDs, and for 27 people we can see the universities that granted their PhDs:
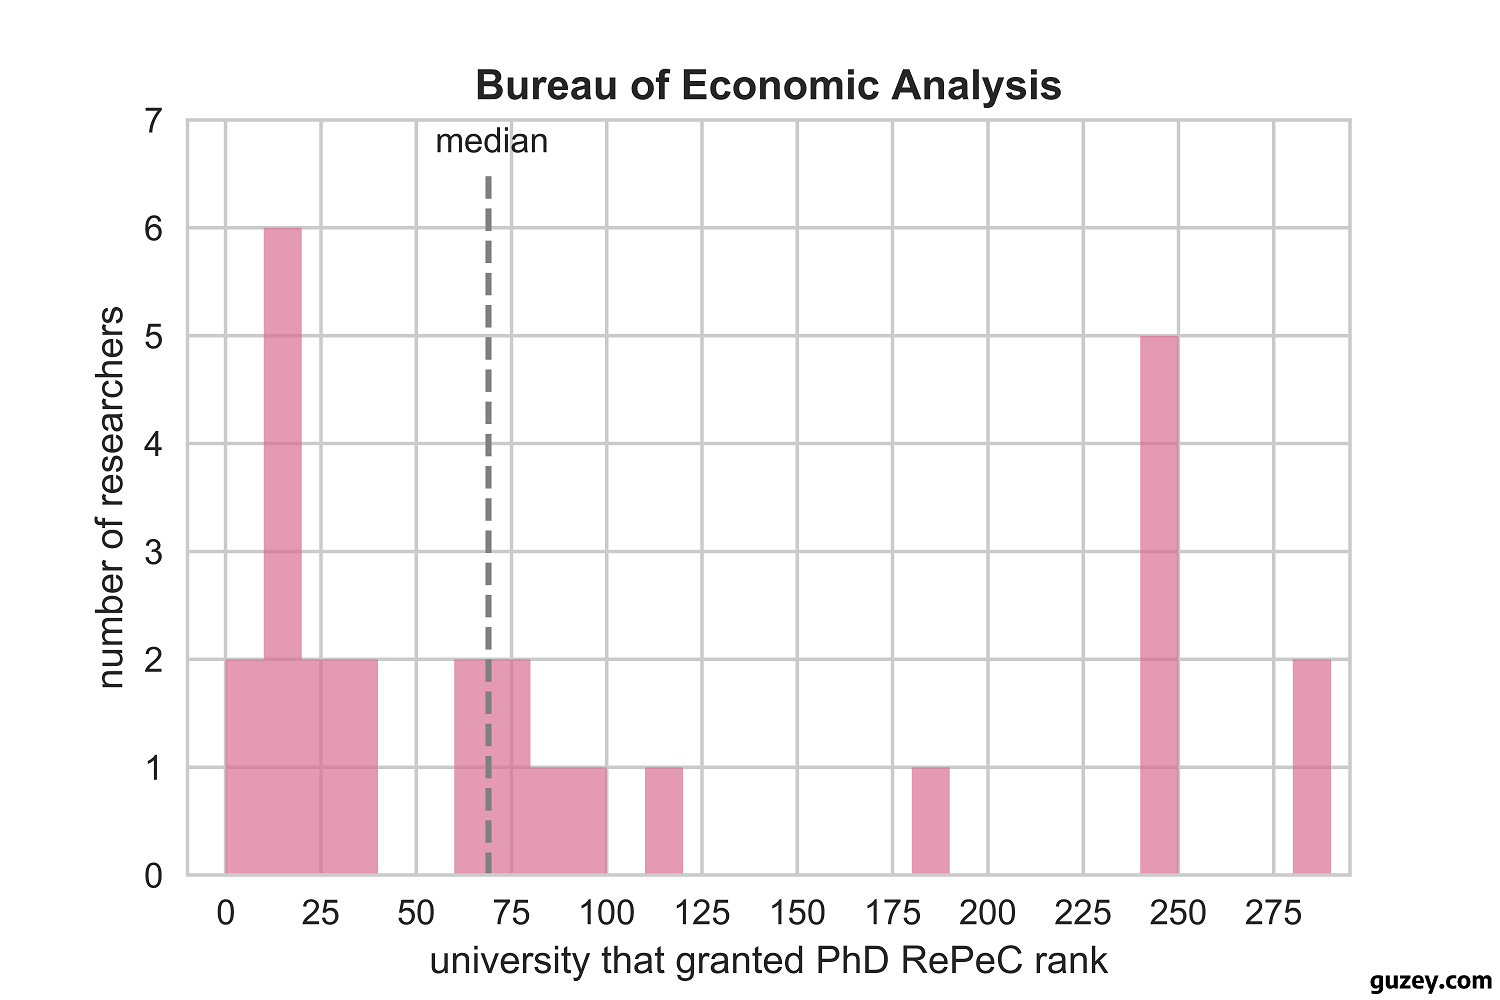
The median researcher at BEA got their Economics PhD at University of Texas-Austin (rank 69). You can look at the full data I used in the appendix.
But BEA is not primarily a research institution and maybe looking at its researchers is not totally fair. So, let’s look at Economists at BEA.
According to FederalPay.org, BEA has 483 employees (LinkedIn lists 348), among them 291 are listed as “Economists” (LinkedIn search for “Economist” at BEA returns 174 results). Of these 174 people:
- about 10 were Research Economists (164 left)
- about 20 had in fact a different occupation (144 left)
- about 10 didn’t have undergraduate institution listed (134 left)
- 2 got their bachelor’s outside of US (132 left)
- only 3 people among Economists had PhDs
I was able to get information about bachelor’s degrees for 88 people out of these 132. The ranking I use is from 2014 and sorts the US universities by their average SAT scores. Some example ranks:
- rank 1 (SAT 1545): California Institute of Technology
- rank 10 (SAT 1470): Northwestern University
- rank 20 (SAT 1440): Swarthmore College
- rank 49 (SAT 1360): Boston College, New York University, Tulane University, Colgate University, United States Air Force Academy
- rank 100 (SAT 1290): University of California-San Diego
- rank 196 (SAT 1205): Baylor University, University of Colorado-Boulder, University of Dayton, Loyola University Chicago, University of Tennessee, University of South Carolina, Michigan Technological University, Hobart and William Smith Colleges, Hope College, Berry College, Belmont University, Cedarville University
The histogram for BEA is:
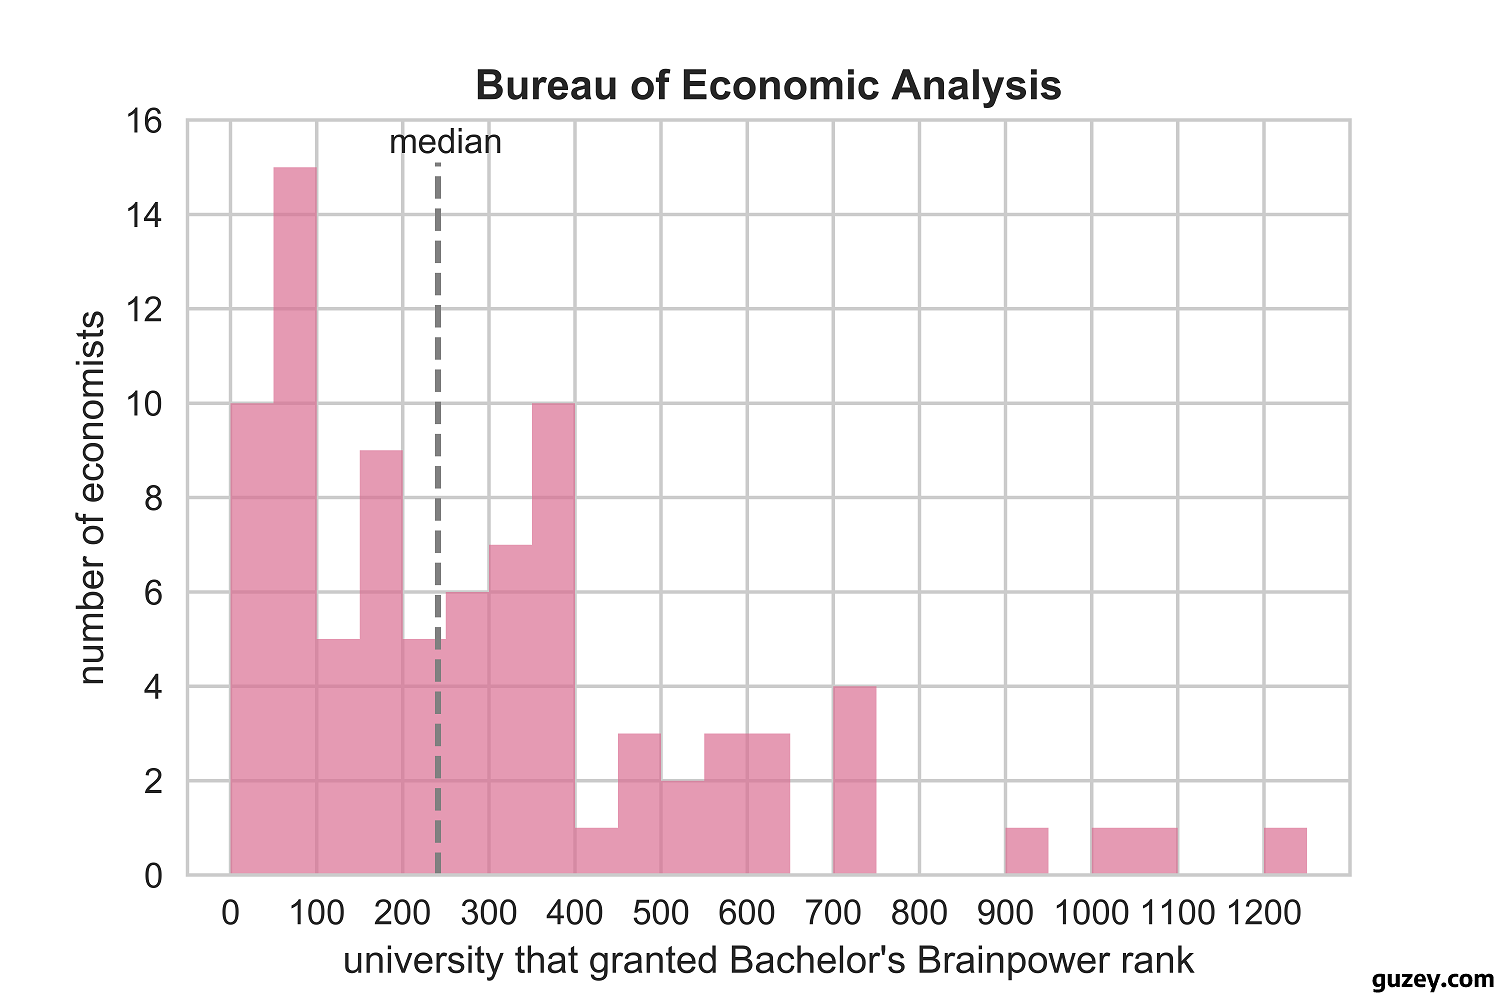
The median Economist at BEA got their Bachelor’s degree at Pennsylvania State University (rank 241, SAT 1175). Zero people finished a top 10 school. An identical argument could be made for most of the other countries’ GDP estimates. Speaking of Russia — I don’t ever hear students at top universities talking about working for Rosstat.
See reddit discussion of this post here.
Why the constancy of the rate of growth, though?
I think it’s likely that this is significantly a result of the phenomenon described in this article:
To Elfin, however, who has a Harvard master’s diploma on his wall, there’s a kind of circular logic to it all: The schools that the conventional wisdom of the meritocracy regards as the best, are in fact the best–as confirmed by the methodology, itself conclusively ratified by the presence of the most prestigious schools at the top of the list. In 1997, he told The New York Times: “We’ve produced a list that puts Harvard, Yale and Princeton, in whatever order, at the top. This is a nutty list? Something we pulled out of the sky?”
According to sources close to the magazine, a bitter internal struggle broke out when it became clear that Caltech was going to come out on top in the late spring of 1999 after the rankings had been changed to count every category the same way. Fallows’ replacement Stephen Smith and new Special Projects Editor Peter Cary were both reportedly shocked to see that, under the new formula Graham had recommended, the conventional wisdom of the meritocracy would be turned upside down, and there were discussions about whether the rankings should be revised to change the startling results. (Morse and Cary both deny this.) Eventually, a decision was made to keep the new formula and U.S. News received a hefty dose of criticism from baffled readers. Morse declined to say how the formula has been changed for the rankings that will be printed on September 4th of this year. But if Caltech’s ranking drops and one of the three Ivies recovers its crown, read the small print carefully. Caltech’s advantage over the second ranked school last year was an astronomical seven points (more than the difference between #2 and #8). The methodology would have to be monkeyed with substantially to drop Caltech out of the top spot.
People expect sliding growth to be 2-3% and whenever it starts to systematically deviate from this, methodology might be gently adjusted to reflect the “““correct””” growth.
Common Objections
GDP estimation is basically accounting. You don’t need Harvard PhDs working on this problem
Nope. Definition of GDP is simple. Actually trying to calculate it is hard. Some example problems:
- how to adjust for errors and inaccuracies in raw data
- what to do with the missing raw data (“imputation” you say, but that is far from trivial and makes historic comparisons problematic)
- how to compare GDP over time, accounting for technological change (“hedonic quality adjustment” you say but that is an argument for my position)
Even if the methodologies tell us how to estimate everything, there’s still a ton of tacit knowledge and ad hoc decisions one needs to make at every step. You can fuck up data analysis in a million of different ways. Also see 1 and 2.
I should add a note here: I neither ever worked on GDP estimation, nor ever worked near a government agency that did it. Most of my knowledge stems from reading Economic papers, BEA documents, and discussions with friends. If you do have good arguments either for estimating GDP being simple or against it — I would love to hear them.
All methodology is done by people at top universities anyways
Uh, maybe? But from my reading of BEA papers this doesn’t seem to be the case. If you actually know anything about this — do let me know.
Acknowledgements
Thanks to Anastasia Kuptsova for data visualization and valuable comments. Thanks to Maxim Alexeev for stimulating discussion. Thanks to Gleb Posobin and Nicholas Perry for helpful suggestions.
Appendix
“This note examines mobile phone CPIs for 12 countries… Their CPIs vary wildly, ranging from no change (for Japan) to over 20 percent declines per annum (for New Zealand and the UK)” (a) (via)
An anonymous reader writes
As someone working in economic statistics, in the UK, this blogpost is on-the-money.
BEA researchers’ PhD insitutions and institutions’ RePeC rank
Minimum, median, and maximum are indicated by color.
| Rank | Institution | Professors’ / Researchers’ PhD institutions RePeC ranks |
|---|---|---|
| 1 | Harvard University | 1, 2, 2, 1, 2, 13, 1, 1, 5, 1, 2, 2, 1, 97, 2, 7, 19, 1, 1, 40, 1, 4, 4, 8, 3, 147, 3, 1, 2, 1, 13, 5, 2, 2, 1, 2, 1, 5, 2, 1, 1, 19, 35, 1, 2, 2, 5, 2, 3, 3, 20, 2, 2, 2, 5, 2, 22, 1, 22, 8 |
| 25 | University of Southern California | 18, 29, 10, 10, 10, 163, 21, 13, 113, 8, 12, 4, 8, 11, 13, 13, 280, 5, 33, 12, 58, 31, 96, 13, 147, 5, 21 |
| New York Fed | 65, 36, 20, 9, 20, 89, 2, 4, 11, 41, 3, 12, 61, 5, 9, 18, 254, 13, 2, 4, 32, 1, 3, 280, 3, 280, 13, 1, 16, 2, 16, 5, 70, 1, 3, 16, 16, 22, 61, 27, 211, 36, 13, 4, 2, 4, 27, 15, 147, 14, 16, 4, 46, 3, 4, 262, 3, 11, 2, 8 | |
| 61 | University of Minnesota | 16, 5, 2, 12, 88, 88, 21, 22, 5, 1, 13, 42, 4, 8, 21, 19, 4, 21, 61, 89, 97 |
| 89 | University of Pittsburgh | 22, 114, 22, 9, 147, 41, 280, 14, 14, 16, 5, 61, 116, 129, 13, 27, 43, 13, 147, 9, 73, 22, 51, 13, 27, 38, 3, 12, 21 |
| BEA | 26, 16, 13, 13, 61, 83, 280, 69, 116, 240, 95, 13, 249, 15, 1, 21, 240, 240, 280, 240, 70, 4, 73, 186, 15, 30, 30 |
| initials | university | RePeC rank (only top 280 are ranked) |
|---|---|---|
| AA | Boston College | 26 |
| BA | University of Pennsylvania | 16 |
| CA | Yale University | 13 |
| MB | Boston University | 13 |
| BB | University of Minnesota | 61 |
| BC | Indiana University | 83 |
| GC | University of Cincinnati | 280 |
| AD | University of Texas at Austin | 69 |
| DF | Purdue University | 116 |
| MG | American University | 240 |
| MG | George Washington University | 95 |
| KH | Yale University | 13 |
| MI | University of Georgia | 249 |
| MK | University of California-San Diego | 15 |
| RK | Harvard University | 1 |
| WL | University of California, Los Angeles | 21 |
| RM | American University | 240 |
| BM | American University | 240 |
| DR | University of Kansas | 280 |
| RR | American University | 240 |
| JS | Johns Hopkins University | 70 |
| RS | University of Chicago | 4 |
| PT | Washington University in St. Louis | 73 |
| SW | George Mason University | 186 |
| TY | University of California, San Diego | 15 |
| DY | University of California at Davis | 30 |
| WZ | University of California at Davis | 30 |
BEA economists’ undergraduate institutions
| initials | undergrad institution | rank |
|---|---|---|
| AB | George Mason University | 295 |
| JH | The College of William and Mary | 47 |
| RC | Vassar College | 35 |
| AY | University of California-San Diego | 100 |
| NP | University of Illinois Chicago | 388 |
| BD | The Catholic University of America | 382 |
| AR | George Mason University | 295 |
| GL | University of Rochester | 57 |
| MS | University of Michigan | 62 |
| RO | San Diego State University | 451 |
| LW | University of California, Davis | 188 |
| TG | Penn State University | 241 |
| BT | Smith College | 67 |
| JD | University of Maryland Baltimore County | 188 |
| LF | The Catholic University of America | 382 |
| SM | University of Maryland - College Park | 81 |
| DD | University of California, Irvine | 258 |
| MK | Binghamton University | 99 |
| EE | DePaul University | 166 |
| RP | University of Mississippi | 410 |
| RG | Miami University | 69 |
| CN | University of Wyoming | 352 |
| HH | University of Maryland College Park | 81 |
| WM | Lawrence University | 102 |
| ES | University of Massachusetts Boston | 611 |
| CM | Salisbury University | 288 |
| DH | University of Maryland College Park | 81 |
| WP | University of South Carolina | 196 |
| KA | University of North Carolina at Greensboro | 713 |
| JH | University of Louisville | 301 |
| BL | Washington State University | 725 |
| LM | University of Mary Washington | 388 |
| CR | The Johns Hopkins University | 26 |
| MR | Michigan State University | 285 |
| NM | Arizona State University | 301 |
| EX | Cornell University | 28 |
| JN | University of Maryland | 81 |
| OK | University of North Carolina at Greensboro | 713 |
| PW | Pomona College | 11 |
| TM | St. Norbert College | 352 |
| EM | Virginia Polytechnic Institute and State University | 180 |
| SK | University of Houston | 334 |
| NH | Claremont McKenna College | 29 |
| DC | James Madison University | 301 |
| EW | Trinity University | 128 |
| NM | Anderson University | 546 |
| DK | University of Maryland Baltimore County | 188 |
| AF | University of Virginia | 55 |
| CL | University of Michigan | 62 |
| AD | Loyola University New Orleans | 301 |
| SA | Penn State University | 241 |
| MS | George Mason University | 295 |
| KR | East Carolina University | 591 |
| KW | Kent State University | 622 |
| PC | Bucknell University | 91 |
| DJ | Saint Louis University | 137 |
| MS | Wheaton College | 166 |
| BV | University at Albany-SUNY | 464 |
| JF | Washington State University | 725 |
| MG | St. Mary’s College of Maryland | 216 |
| CS | University of Illinois at Urbana-Champaign | 102 |
| FN | St. Joseph’s College | 388 |
| MT | James Madison University | 301 |
| AG | University of Central Florida | 237 |
| SB | Hawaii Pacific University | 937 |
| MH | University of Pennsylvania | 18 |
| RM | University of Oregon | 382 |
| JH | The College of William and Mary | 47 |
| MC | Oklahoma State University | 301 |
| PG | Virginia Polytechnic Institute and State University | 180 |
| RT | Youngstown State University | 1090 |
| EB | John Carroll University | 352 |
| LM | University of Maryland College Park | 81 |
| DB | Frostburg State University | 1049 |
| LW | Ohio University | 388 |
| JM | Portland State University | 622 |
| AB | University at Albany-SUNY | 464 |
| TH | Morgan State University | 1232 |
| TP | St. Mary’s College of Maryland | 216 |
| MF | University of Maryland Baltimore County | 188 |
| MH | University of California, Berkeley | 42 |
| JG | University of Tampa | 591 |
| RN | University of Michigan | 62 |
| CB | University of Maryland College Park | 81 |
| CE | Mount St. Mary’s University | 509 |
| LN | Wellesley College | 29 |
| TM | East Carolina University | 591 |